For research use only. NOT for use in diagnostic procedures.
 Figure 1. Structures of T3, rT3 and T4.
Introduction
This application note describes a polymer-based strong anion exchange mixed-mode SPE protocol for the extraction of T3, rT3 and T4 from serum prior to LC-MS/MS analysis.
The method described in this application note demonstrates selective extraction of the thyroid hormones T3, rT3 and T4 from serum. 200 µL of serum was extracted using the EVOLUTE® EXPRESS AX 30 mg fixed well plate format. High reproducible recoveries and low phospholipid content were observed, demonstrating limits of quantitation < 50 pg/mL.
Analytes
Tri-iodothyronine (T3), reverse Tri-iodothyronine (rT3) and Thyroxine (T4).
Sample preparation procedure
Format
EVOLUTE® EXPRESS AX 30 mg fixed well plate, part number 603-0030-PX01.
Serum pre-treatment
To serum (200 µL) add internal standard (D6-T3/rT3, 10 µL of 25 ng/mL solution).
Add a further 100 µL of a mixture of citric acid, ascorbic acid and DL-dithiothreitol (25 mg/mL) and vortex mix thoroughly.
Note: the use of these stabilizers prevents conversion of T4 to T3 and rT3 during extraction.
Solid phase extraction
Plate conditioning
Condition each well with MeOH (1 mL).
Plate equilibration
Equilibrate each well with H2O (1 mL).
Sample loading
Load the entire volume of pre-treated sample.
Wash 1
Elute interferences with 50 mM NH4OAc buffer, pH 9 aq (1 mL)
Wash 2
Elute interferences with MeOH (1 mL).
Wash 3
Elute interferences with 2% formic acid in DCM (v/v) (1 mL).
Elution
Elute analytes with MeOH (500 µL).
(Optional) Add 2 µL of ethylene glycol to the collection plate and mix prior to evaporation.
Post elution
Evaporate at 40 °C in a stream of air or nitrogen using a Biotage® SPE Dry.
Note: The use of ethylene glycol helps to minimize non-specific binding to the plastic collection plate by avoiding complete drying during the evaporation procedure.
Reconstitution
Reconstitute the sample with H2O/MeOH (50/50 (v/v), 150 µL).
UPLC conditions
Instrument
Waters ACQUITY I-Class
Column
ACE EXCEL2 C18-AR UHPLC column (2 μ, 100 x 2.1 mm id)
Mobile phase
A: 2 mM ammonium acetate/0.1% formic acid (aq)
B: 2 mM ammonium acetate/0.1% formic acid/MeOH
Flow rate
0.4 mL/min.
Table 1. Gradient conditions.
|
Time |
% A |
% B |
Curve |
|
0 |
40 |
60 |
1 |
|
3 |
23 |
77 |
6 |
|
3.1 |
40 |
60 |
1 |
Curve 1: Conditions in subsequent line initiated immediately once time passed. i.e. 40:60 resumed at 3 minutes.
Curve 6: Linear Gradient
Injection volume
10 μL (partial loop with overfill)
Sample temperature
10 °C
Column temperature
40 °C
Mass spectrometry conditions
Instrument
Xevo TQ-S triple quadrupole mass spectrometer equipped with an electrospray interface for mass analysis.
Desolvation temperature
500 °C
Ion Source temperature
150 °C
Collision cell pressure temperature
3.7 e-3 mbar
Positive ions acquired in the multiple reaction monitoring (MRM) mode:
Table 2. MRM conditions (Qualifier ion details shown in parenthesis).
|
Compound |
MRM Transition |
Cone Voltage (V) |
Collision Energy (eV) |
|
T3 |
651.8 > 605.8 |
22 |
|
|
(651.8 > 507.8) |
50 |
(22) |
|
|
(651.8 > 478.9) |
(35) |
||
|
rT3 |
651.8 > 605.8 |
22 |
|
|
(651.8 > 507.8) |
50 |
(22) |
|
|
(651.8 > 478.9) |
(35) |
||
|
T3/rT3-d6 ISTD |
657.8 > 611.8 |
50 |
22 |
|
T4 |
777.7 > 731.7 |
25 |
|
|
(777.7 > 351.0) |
50 |
(45) |
|
|
(777.7 > 633.8) |
(23) |
||
Results
Good chromatographic separation of T3/rT3 and T4 was achieved in less than 3 minutes, as shown in Figure 2 Figure 2. Chromatographic separation of T3, rT3 and T4 from spiked serum at 50 pg/mL.
Recovery
Stripped serum was spiked at various levels from 25–2000 pg/mL. High reproducible recoveries > 85% with corresponding RSDs < 10% were demonstrated. Typical recovery data at 2 ng/mL is shown in Figure 3.
Calibration curves
Calibration curves were generated using stripped serum spiked at concentrations from 25–1000 pg/mL. Good coefficients of determination were obtained for T3 and rT3 (r2 > 0.99). Residual endogenous levels of T4 contributing towards a substantial intercept affected calibration curve performance.
Calibration curves were run before and after multiple serum samples to demonstrate robustness of quantification using this method.
 Figure 3. Recovery profile for thyroid hormones extracted at 2 ng/mL.
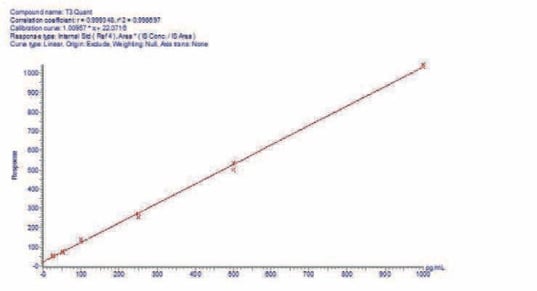
 Figure 4. Spiked serum calibration curve demonstrating T3 linearity from 25–1000 pg/mL (curves run before and after real samples).
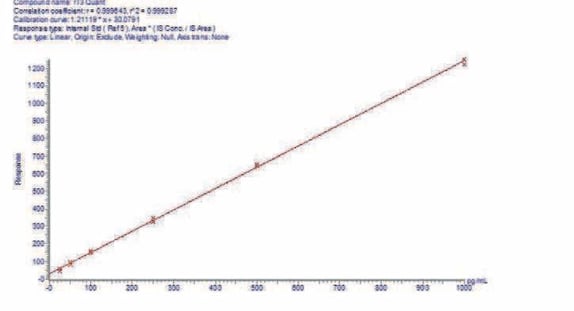
 Figure 5. Spiked serum calibration curve demonstrating rT3 linearity from 25–1000 pg/mL (curves run before and after real samples).
 Figure 6. Plots demonstrating T3 and rT3 ISTD performance over calibration curves.
Phospholipid removal
Phospholipids were investigated to provide an indication of extract cleanliness. We investigated the most abundant phospholipids (selected from full scan, SIR and precursor ion scanning experiments) using MRM transitions monitoring the common 184 product ion. Figure 8 shows phospholipid content comparing protein precipitated serum, and serum extracted using the optimised extraction protocol.
The complete removal of matrix phospholipids improves assay robustness.
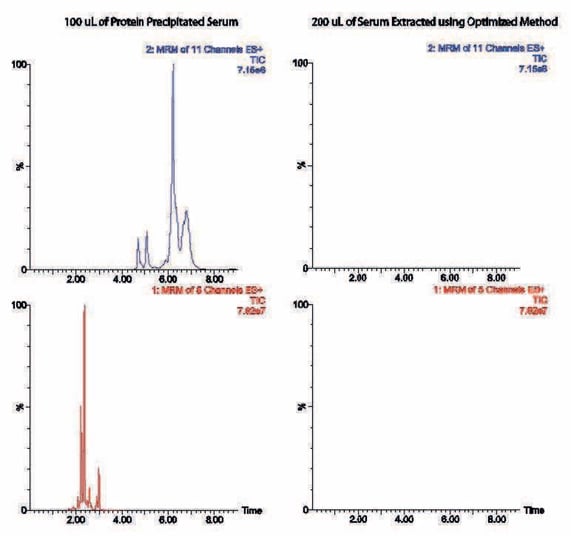
Figure 7. MRM TICs comparing phospholipid content (precipitated serum sample (L) and extracted serum sample (R))
Additional notes
- Stabilizers are added to the sample at the pre-treatment stage prior to extraction to prevent conversion of T4 into T3/rT3 during the extraction procedure, which is otherwise possible under various pH conditions.
- High pH conditions (pH 9) are used in wash 1 to ensure ionisation (de-protonation) of the carboxylic acid group (and suppress ionization of the amino group) during wash steps and therefore maintain full retention of the analytes on
the EVOLUTE® EXPRESS AX strong anion exchange sorbent during the subsequent methanol wash. - An additional wash step using acidified dichloromethane (DCM) is incorporated to further clean up the extract, and improve robustness and reproducibility of the analytical method. Acid was required to give optimum matrix removal, and the use of DCM prevented analyte loss during this wash, despite the change in pH conditions neutralizing the carboxylic group and breaking anion exchange interaction. Analytes were not lost due to their low solubility in DCM.
- Pure methanol can be used to elute the analytes following the rigorous wash protocol, due to the residual acidic condi- tions on the column. Analytes are eluted due to their high solubility in methanol.
- T4 is generally present at much higher levels than T3/rT3, and conversion of species can occur during sample storage, increasing the apparent levels of T3/rT3. In addition, conversion of T4 to T3/rT3 can also occur in the MS source, potentially leading to inaccurate quantification and iodine deposits in the MS system, so a good chromatographic separation of the species is essential. If T4 is not being analysed, it is good practice to divert T4 to waste prior to the MS.
Buffer preparation
- Preservative mixture at 25 mg/mL: Citric acid, ascorbic acid and DL-dithiothreitol. Weigh 250 mg of each and dissolve in H2O. Make up to 10 mL in H2O.
- 50 mM NH4OAc buffer at pH 9 (aq): Weigh 3.854 g and dissolve in H2O. Adjust pH to 9 with NH4OH (28–30% concentration) and make up to 1 L.
- 2% formic acid in DCM: Take 98 mL of DCM and add 2 mL of formic acid (98% stock).
- 2 mM ammonium acetate/0.1% formic acid (aq): Weigh 0.15416 g and dissolve in H2O. Add 1 mL of formic acid and make up to 1 L in H2O.
- 2 mM ammonium acetate/0.1% formic acid/MeOH: Weigh 0.15416 g and dissolve in MeOH. Add 1 mL of formic acid and make up to 1 L in MeOH.
Processing conditions
Positive pressure
Process at approximately 1–2 psi.
Vacuum processing
Process at approximately -0.2 bar.
Conditioning and equilibration steps
EVOLUTE® EXPRESS 96-well plates may be used without conditioning and equilibration steps. Evaluate the requirement for these steps during method development.
Chromatographic separation
- It is important to get chromatographic separation of the T4 from T3/rT3 peaks as ESI sources induce de-iodination of the T4 forming both T3/rT3.
- Good chromatographic separation may also be achieved using acetonitrile in place of methanol as the organic modifier in mobile phase B, along with alternative HPLC column chemistry.
Automated extraction
The method described in this application note is compatible with automation using Biotage® Extrahera™. Contact Biotage for more information.
Ordering information
|
Part Number |
Description |
Quantity |
|
603-0030-PX01 |
EVOLUTE® EXPRESS AX 30 mg Fixed Well Plate |
1 |
|
For Manual Processing |
||
|
121-9600 |
Biotage® VacMaster-96 Sample Processing Manifold |
1 |
|
PPM-96 |
Biotage® PRESSURE+ 96 Positive Pressure Manifold |
1 |
|
Evaporation |
||
|
SD-9600-DHS-EU |
Biotage® SPE Dry 96 Sample Evaporator 220/240V |
1 |
|
SD-9600-DHS-NA |
Biotage® SPE Dry 96 Sample Evaporator 100/120V |
1 |
Literature Number: AN881
