Introduction
The rapidly growing field of antibody and protein engineering continues to create the demand for technologies that increase the productivity and throughput of protein interaction analysis. We will describe a unique yet simple automated process to purify and enrich antibodies and proteins using PhyTip® columns and their subsequent quantification using a microfluidic LabChip device. Using this automated sample enrichment technique, proteins can be purified from complex samples, for example, the purification of IgGs from hybridoma cell culture supernatants.
PhyTip columns
Biotage has developed a unique, yet simple process to purify and enrich antibodies and proteins with different chromato- graphic separation media (affinity, gel filtration, normal phase, reverse phase, and ion exchange). PhyTip columns from Biotage can be used in applications ranging from simple low throughput to fully automated 96-well processes. These unique devices are capable of preparing concentrations of up to 5 mg/mL of purified proteins in small final volumes e.g. 10–20 μL, in less than 15 minutes.
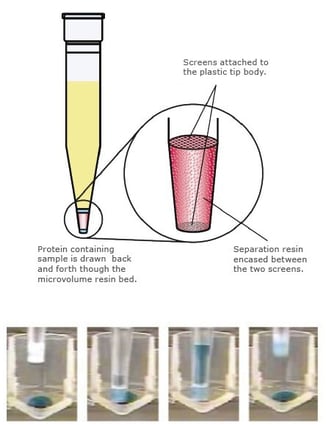
To demonstrate the effectiveness of this new sample preparation system, antibodies were processed with PhyTip columns. These columns are specifically designed to contain micro-volume quantities of conventional affinity separation media in a manner that introduces virtually zero dead volume. PhyTip columns are available as either 200+ columns (for use with 200 μL pipettors) or 1000+ columns (for use with 1 mL pipettors).
PhyTip columns encapsulate a small amount of resin within the end of a pipette tip. Columns are available in two sizes, 1000+ and 200+, containing 10, 20, 40, 80, 160, and 320 microliters and 5 and 10 microliters of separation media, respectively. The choice in column size provides flexibility in enrichment capacity and throughput.
PhyTip enrichment process
The design of the columns allows for reproducible and predictable fluid flow through the micro-volume of affinity resin. The images above show a dye solution to illustrate the elution process within the tips. 10 μL of elution buffer is placed in the bottom of a 96 well plate. After loading and washing steps are complete, the elution buffer is passed repeatedly through the bed to maximize recovery from the column. The characteristics
of the bed and screen design maintain an intact volume of elution buffer, allowing for high enrichment factors and reproducible performance.
IgG binding capacity
Protein A PhyTip IgG binding capacity
The Protein A PhyTip 1000+ columns were characterized with respect to their maximum binding capacity. A titration of monoclonal murine IgG2a in 500 μL PBS was processed, demonstrating IgG binding capacities exceeding 100 μg. It was determined at low levels of IgG (10 μg) that recoveries on the order of 80% of initial antibody are possible in final volumes of 20 μL (15 μL low pH elution buffer + 5 μL 200 mM phosphate neutralization buffer). Accurate quantitation of IgG was performed by offline reduction of the IgG sample with TCEP (17 mM TCEP, room temperature for 16 hours), followed by HPLC analysis and absorbance detection at 214 nm.
Protein characterization using the LabChip GXII
Microfluidic Chip and sample preparation
- Protein samples are denatured and reduced in a high concentration of SDS and BME
- The microfluidic chip is loaded with gel/dye and marker
- The chip and sample plate are loaded onto the instrument and the software is started
|
Initial IgG (µL) |
Initial IgG (µg) |
Bound IgG (pg) |
% Bound |
|
10 |
<2 |
>8 |
>80 |
|
50 |
4 |
46 |
92 |
|
100 |
16.5 |
83.5 |
84 |
|
150 |
47.5 |
102.5 |
68 |
|
200 |
71 |
129 |
65 |
On-Chip sample processing
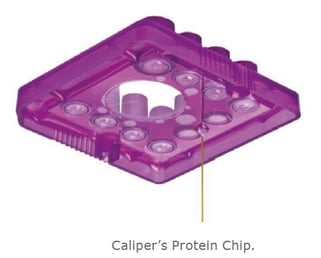
- A vacuum is applied at well 1 through the pressure load channel to aspirate the sample from the well plate, through the sipper and onto the chip
- Voltage is applied between wells 3 and 8 to electrokinetically inject a sample plug
- Voltage is then applied between wells 7 and 10 to perform electrophoretic separation and staining
- Electrokinetic destaining and detection is achieved by diluting the separation channel contents from wells 2 and 9
 Destain and detection region of the LabChip GXII protein chip. The image on the right is an actual photo of this region.
Sciclone ALH 3000
A dilution series of murine monoclonal IgG2a ranging from 0 to 50 μg/mL was added to DMEM + 10% FBS. 200 μL of each sample was added to a 96-well source plate, simulating standard high-throughput hybridoma cell culture conditions. Automated enrichment was performed using Caliper’s Sciclone ALH 3000 with a High Volume Head (volumes up to 200 μL). The Biotage PhyTip Protein A columns were loaded directly on to the mandrels of the ALH 3000 High Volume Head head.
The following method was used for enrichment:
|
|
Flow rate (µL/s) |
Volume (µL) |
# Cycles |
|
Capture |
4 |
200 |
2–12 |
|
Wash 1 |
10 |
160 |
2 |
|
Wash 2 |
10 |
160 |
2 |
|
Enrich |
4 |
10 |
4 |
 The ALH 3000 provides highly controlled reproducible flow rates for the 96 tips head. The Gripper removes and holds the lid from the elution plate, minimizing any evaporation or contamination.
Optimization of IgG enrichment
Virtual gel image of IgG Enrichment as a function of capture cycles
DMEM (200 μL) was spiked with +/- 20 μg/mL mouse IgG2a. Samples were processed with various numbers of capture cycles on the Sciclone ALH 3000. 5 μL of each sample were analyzed under reducing conditions on the Caliper LabChip GXII. The fold enrichment was determined from the sum of the mass of the heavy and light chains as measured by the LabChip GXII data regression software. Enrichment factors reported are calculated relative to the mouse IgG2a standard run under identical conditions on the LabChip GXII. The average of 3 replicate samples is reported. Purities of the enriched IgGs were greater than 95% for all conditions, with maximum recovery observed at 8 cycles.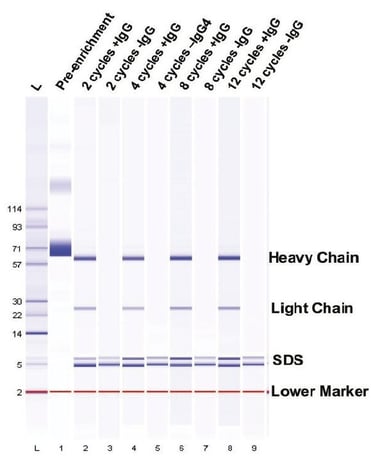
|
Number of Cycles |
Fold Enrichment |
|
2 |
10.7 |
|
4 |
11.4 |
|
8 |
12.7 |
|
12 |
12.3 |
Enrichment from DMEM/10% FBS
Virtual gel image and electropherograms of pre and post Protein A enrichment from DMEM/FBS
 5 μL of each sample were prepared and run under reducing conditions on the Caliper LabChip GXII using the HT Protein 200 Reagent Kit and Chip. The concentration of mAb (μg/mL) in the starting samples are indicated at the top of each lane of the
virtual gel. The heavy and light chains migrate with a molecular weight of 65 kDA and 26 kDa respectively. The system SDS peaks migrate between 5 kDa and 10 kDa. The lower marker, 2 kDa, is shown in red on the virtual gel and by the green arrow on the electropherograms. The vast majority of FBS proteins evident in the pre-enriched samples are removed from the final material by the automated enrichment protocol. Quantification of the final material results in purity levels exceeding 99%.
The electropherogram shows the pre and post-enrichment profiles from the sample containing 20 μg/mL mAb. The lower markers for both samples have similar fluorescence (~450 fluorescent units). After enrichment the mAb bands are easily identified and quantified by the software.
Summary
Automated selective enrichment of monoclonal antibodies from hybridoma growth media using PhyTip Protein A columns on the Sciclone ALH 3000 workstation enables simultaneous purification of up to 96 samples in under 15 minutes. Subsequent characterization (size, concentration, purity) of the enriched material using the LabChip GXII microfluidic protein analysis system provides a streamlined workflow and significant reduction in time and labor associated with high-throughput protein expression and purification. The purity and concentration of the final product enables downstream analytical and biochemical assays in numbers that cannot be readily achieved using conventional methods.
Literature Number: AN401
