Introduction
Per- and polyfluoroalkyl substances (PFAS) have been widely manufactured and utilized across numerous industrial and consumer applications since their introduction in the mid-20th century. Their exceptional chemical stability and persistence have made them a major focus of global regulatory oversight and analytical testing. To meet evolving detection standards, laboratories increasingly rely on EPA Method 533, which targets a broad range of short-chain PFAS compounds in drinking water. This application note presents a validated workflow designed to deliver reliable, compliant results under EPA Method 533. Data were generated using the Biotage® PrepXpert-8 automated solid-phase extraction (SPE) system, in combination with EVOLUTE® PFAS 533 SPE cartridge and a TurboVap® LV system, providing a robust, automated approach for accurate and reproducible PFAS analysis. This workflow simplifies PFAS sample preparation, improves throughput, and ensures compliance with stringent regulatory requirements.
Analytes
Full list of analytes in Table 1 here.
Solution preparation
2% NH4OH in MeOH
-
Add 2 mL of NH4OH for every 98 mL of methanol to a clean beaker.
-
Agitate to homogenize the solution.
-
Prepare fresh daily before extraction.
0.1 M phosphate buffer solution
-
Add 4.45 g of monobasic sodium phosphate and 2.5 g of dibasic sodium phosphate for every 500 mL of reagent water to a clean beaker.
- Sonicate the solution for 5 minutes to dissolve the salt.
NH4Ac in water solution
-
Add 1 g of NH4Ac for every 1 L of reagent water to a clean beaker.
- Sonicate the solution for 5 minutes to dissolve the salt.
Working spiking solution
- Dilute 100 µL of the Native Stock Solution with 900 µL of methanol to achieve spike solution of 50 ppt.
Sample preparation procedure
-
Clean the automated extractor system using the technique given in Appendix A. If the cleanliness of a particular channel is suspect, it is recommended that the cleaning method be run multiple times and that the cleanliness be verified by extracting blanks.
- Set up and fill in new sample containers with reagent water; both 100 mL and 200 mL volumes were used for this application.
- Add the appropriate amount of NH4Ac to each of the sample containers; for example, 0.10 g and 0.25 g were added to the 100 mL and 250 mL samples respectively.
- Verify that the pH of the sample is between 6.0 and 8.0 and adjust using acetic acid if necessary.
- Prepare for the determination of the initial sample volume by either marking the level of the sample on the container or by weighing the sample container.
- Fortify each sample with an internal standard at a concentration corresponding to the mid-range of the calibration curve. If desired, add a known amount of PFAS target compounds into the samples.
- Attach each prepared water sample to the bottle rinse heads on the Biotage® PrepXpert-8 system, ensuring the sip tube is positioned in the lowest corner of the container.
- Load the desired EVOLUTE® PFAS 533 cartridge onto Biotage® PrepXpert-8.
- Load 15 mL centrifuge tubes onto the collection rack and place into the Biotage® PrepXpert-8.
- Run the method given in Table 2, adjusting for the preferred sample volumes, to extract the attached samples. The protocol will yield an extract of approximately 10 mL in volume.
- Determine the initial sample volume by either using a graduated cylinder and filling the sample container to the original mark or by taking an additional weight of the container.
- Transfer the centrifuge tubes to the TurboVap® LV system and evaporate the samples to dryness using nitrogen according to the parameters in Table 3.
- Reconstitute each sample using 990 μL of 80:20 methanol: reagent water and transfer to an autosampler vial.
- Add 10 μL of the isotope performance standards and mix to homogenize.
- Load the extract onto a calibrated LC-MS/MS system and process using the conditions given in the below sections.
Table 2. Extraction parameters
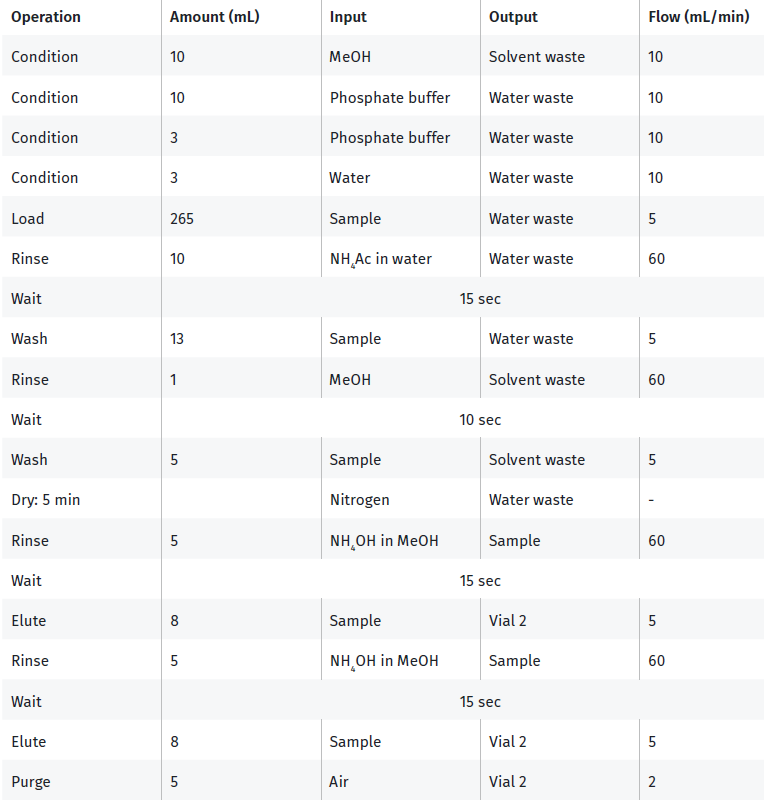
Table 3. TurboVap® LV concentration protocol
|
Bath temp: |
60 °C |
|
Evaporation mode: |
Method (Ramp gradient) |
|
Manifold setup: |
48 positions |
|
Rack row height: |
120 mm |
|
Step 1: |
1.5 L/min for 20 min |
|
Step 2: |
3.0 L/min for 15 min |
|
Step 3: |
3.5 L/min for 50 min |
LC-MS/MS conditions
Agilent 1290 Infinity II LC System
-
1290 Infinity II Multicolumn Thermostat, G7116B
-
1290 Infinity II Multi sampler, G7167B
-
1290 Infinity II High Speed Pump, G7120A
Columns
-
InfinityLab PFC Delay column, 4.6 x 30 mm, p/n 5062-8100
-
Guard column: ZORBAX Eclipse Plus C18, 2.1 x 5 mm, 1.8 µm, p/n 821725-901
-
Analytical column: ZORBAX RRHD Eclipse Plus C18, 95 Å, 2.1 x 50 mm, 1.8 µm, p/n 959757-902
Mobile Phases
A: 20 mM ammonium acetate in water
B: Methanol
Table 4. LC Gradient
|
Time (min) |
%A |
%B |
|
0.50 |
95 |
5 |
|
3.00 |
60 |
40 |
|
16.00 |
20 |
80 |
|
18.00 |
20 |
80 |
|
20.00 |
5 |
95 |
-
Flow rate: 0.2 mL/min
-
Injection volume: 5 μL
-
Column temperature: 50 ˚C
Agilent 6470 MS/MS, G6470B
-
Gas temperature: 230 ˚C
-
Gas flow: 4 L/min
-
Nebulizer: 20 psi
-
Sheath gas temperature: 375 ˚C
-
Sheath gas flow: 12 L/min
-
Capillary voltage (Positive): 3500 V
-
Capillary voltage (Negative): 2500 V
-
Nozzle voltage (Positive): 500 V
-
Nozzle voltage (Negative): 0 V
For a complete listing of MRM Transitions, see Appendix B.
Results
System calibration
For the work being done here, a total of five points were used in the calibration covering a range of 0.2-100 ppt. The calibration curve was forced through zero and achieved excellent R2 values.
 Figure 1. Calibration curve plots for PFOS and PFOA. Additional calibration curves for all other target analytes listed in Table 1 are provided in Appendix C.
Determination of the minimum reporting level (MRL) and detection limits (DL)
A target minimum reporting level (MRL) of 2 ng/L was selected and ten replicate laboratory fortified blanks (LFBs) were created and run at that concentration, with at least eight data points being selected for each compound. This experiment was replicated twice: one dataset used 100 mL samples with the 200 mg cartridge, and the other used 250 mL samples with the 500 mg cartridge. The resulting data was then used to calculate the half-range for the prediction interval (HRPIR), the upper and lower bounds for the PIR, and the DL for both iterations of this experiment.
Figure 2 below illustrates the calculated detection limit (DL) for all EPA 533 target compounds ranging between 0.13 ng/L to 0.38 ng/L across both datasets. Figures 3 and 4 illustrate the upper and lower bounds for the PIR for the 200 mg and 500 mg cartridge respectively. Based on the data obtained, the calculated upper and lower predicted interval range (PIR) were all well within the specified boundaries and proven to be repeatable. 11Cl-PF3OUdS was identified to behave erratically when compared to the associated labelled compound, this necessitated the removal of clear outliers from the DL study, still maintaining a minimum of 8 data points for this compound.
 Figure 2. MRL and DL recoveries for EVOLUTE® PFAS 533 cartridges (200 mg and 500 mg). Compounds marked with an asterisk were analysed in salt form.
 Figure 3. Predicted interval range (PIR) limits for EVOLUTE® PFAS 533 200 mg cartridge, with acceptance range shown in white. Compounds marked with an asterisk were analysed in salt form.
 Figure 4. Predicted interval range (PIR) limits for EVOLUTE® PFAS 533 500 mg cartridge, with acceptance range shown in white. Those compounds with an asterisk were used in salt form. The data for individual compounds is shown in Appendix D.
Initial demonstration of precision and accuracy (IDP, IDA)
Four LFB samples each were prepared at concentrations of 20 ng/L for 100 mL volume samples using 200 mg cartridges and 250 mL volume samples using 500 mg cartridges. This data was used to determine the precision and accuracy of the sample preparation process, Figure 5 below illustrates the accuracy while Figure 6 illustrates the precision; all target compounds exhibited tight recoveries, recovering on average between 81%-102% of the spiked amount and had calculated CV less than 6.7%. These results fall well within the limits defined by EPA Method 533 of +/- 30% of the nominal value with relative standard deviations under 20%. Figure 5. Initial Demonstration of Accuracy (20 ng/L, n=4) for EVOLUTE® PFAS 533 cartridges (200 mg and 500 mg). Compounds marked with an asterisk were analysed in salt form.
 Figure 6. Initial Demonstration of Accuracy (20 ng/L, n=4) for EVOLUTE® PFAS 533 cartridges (200 mg and 500 mg). Compounds marked with an asterisk were analysed in salt form. The data for individual compounds is shown in Appendix E.
Demonstration of low system background
A study was conducted to investigate each part of the extraction process and any potential contribution to PFAS background. This sequential process is visualized below and highlights each component of the full extraction process as they are screened for PFAS background contribution before finally being combined into a single process when extracting the Reagent Water Blank samples.
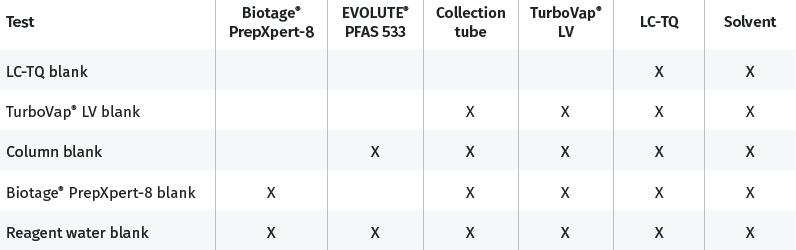
 Figure 7. Contribution of the TurboVap® LV to the PFAS background levels. Compounds marked with an asterisk were analysed in salt form.
 Figure 8. Contribution of the EVOLUTE® PFAS 533 cartridge to the PFAS background levels. Compounds marked with an asterisk were analysed in salt form.
 Figure 9. Contribution of the Biotage® PrepXpert-8 to the PFAS background levels. Compounds marked with an asterisk were analysed in salt form.
 Figure 10. PFAS background levels for full LRB extraction using EVOLUTE® PFAS 533 cartridge. Compounds marked with an asterisk were analysed in salt form.
For those results which were generated using only the analytical system, all target analytes were N.D. (unable to be separated from the noise in the baseline) and so not listed out in the previous tables. When examining the resulting data for the Biotage® PrepXpert-8, the EVOLUTE® PFAS 533 cartridge, and the TurboVap® LV blanks, only trace levels of PFAS are observed, however these trace levels are all well below the lowest curve point of the calibration and will not interfere with water sample extractions.
When evaluating the LRB sample extractions, it can be seen that there are indications of the presence of a PFAS background at very low levels. However, even at the highest concentrations detected, all levels are much lower than the 1/3 MRL limit indicating that the background is acceptable.
NFDHA can be seen in the background at slightly higher levels than other compounds during the reagent water blank extractions, however upon further investigation it was determined that much of this is due to the nature of the curve fit of the calibration to allow for a range of 0.2-100 ng/L. Results at the lowest point of the curve for this compound were seen to be elevated due to this. If this compound is of particular interest, it is suggested to remove the upper levels of the calibration curve in order to get a more representative indication of the background.
Examination of system carryover
To simulate an influent sample, four LFB samples were created with concentrations which were equal to the highest point on the calibration curve (100 ppt). These samples were extracted, and the clean up procedure given in Appendix A was run three times. To ensure that the system background was adequately reduced, a set of four LRB samples were extracted immediately after the cleaning procedure and analysed. The LRB data obtained from this study is presented in Appendix F and illustrated in figure 11.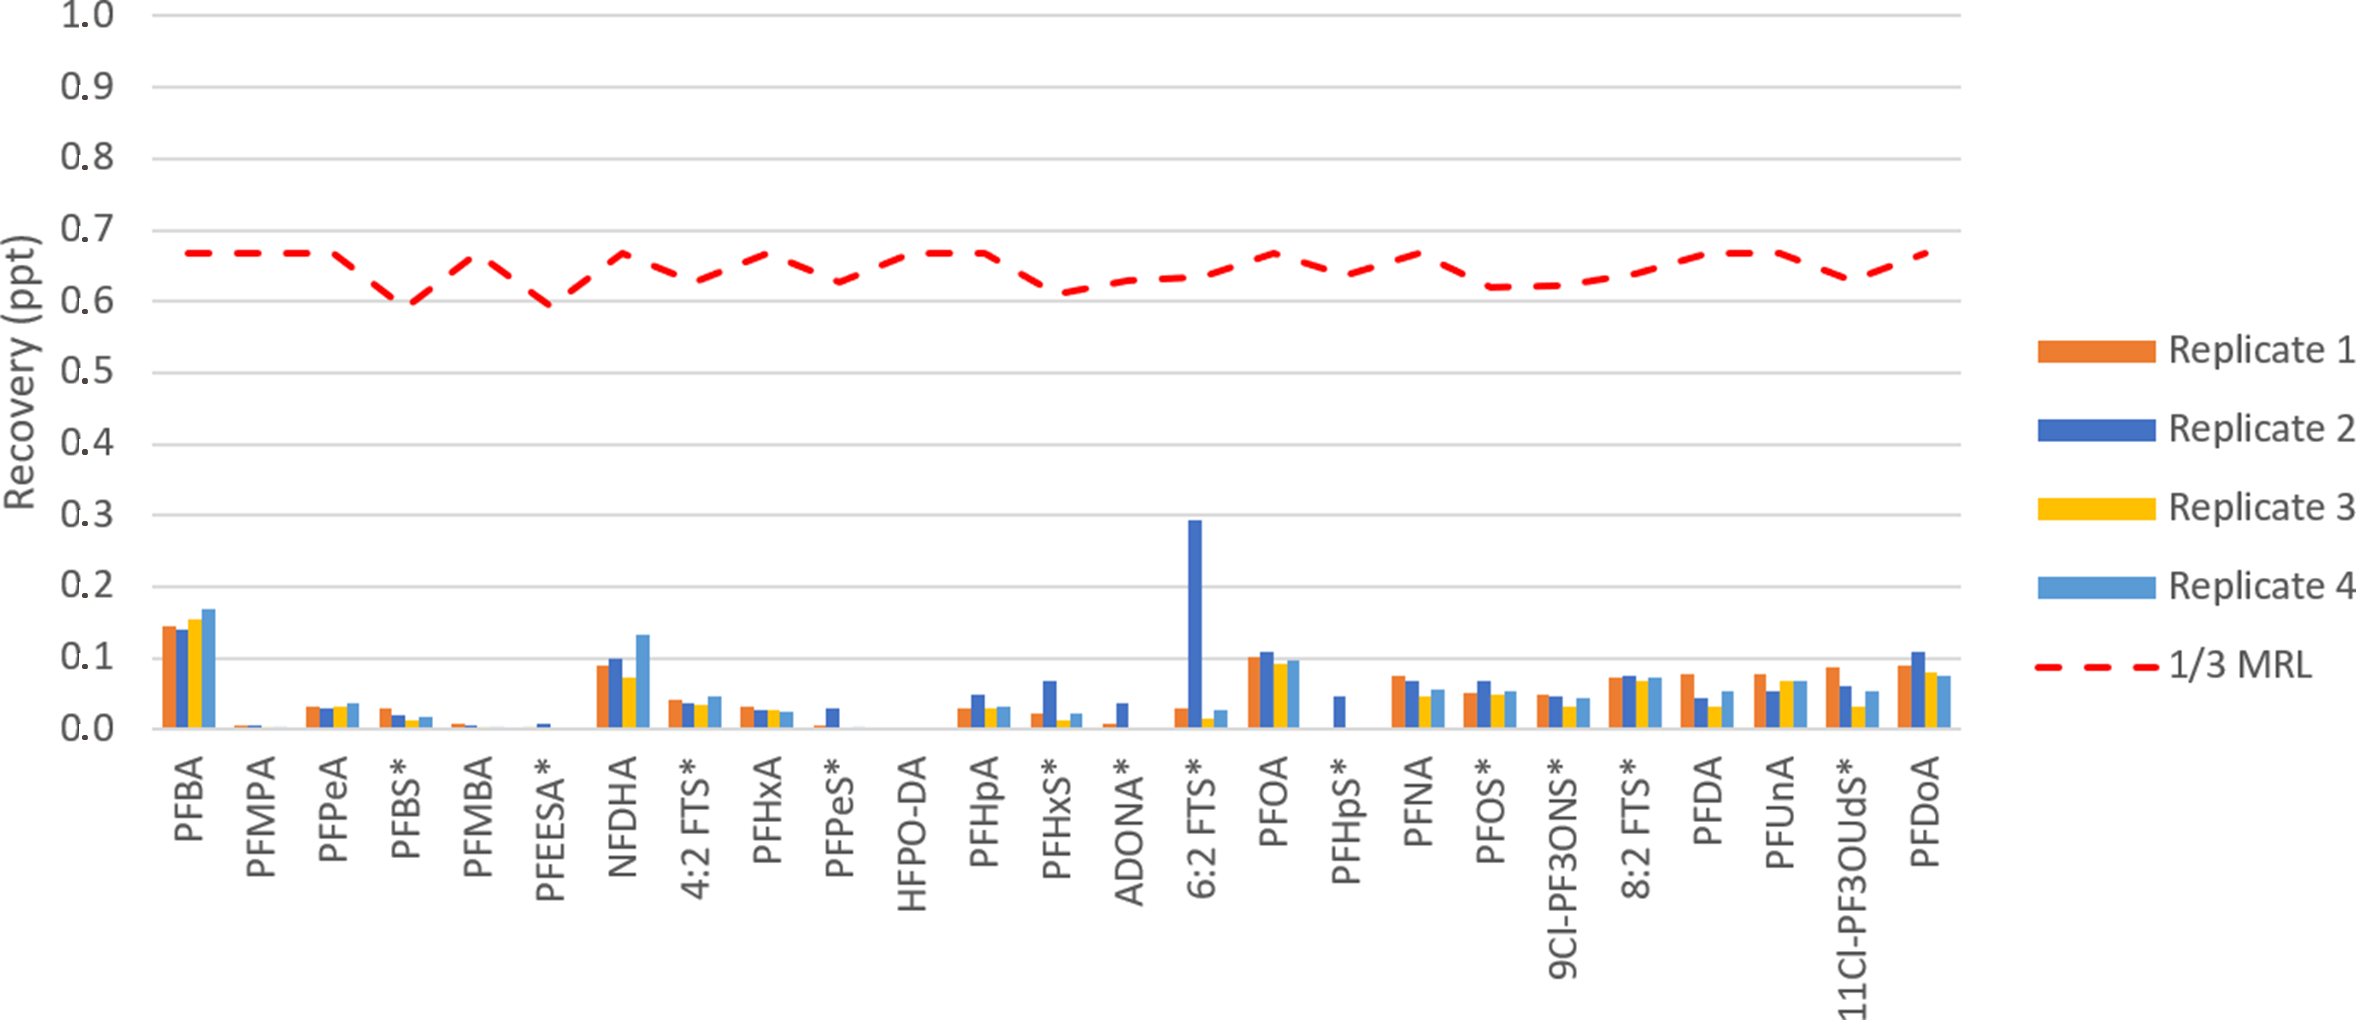
Figure 11. Carryover study results after processing four 100 ng/L LFB samples using EVOLUTE® PFAS 533 500 mg/6 mL cartridge. Compounds marked with an asterisk were analysed in salt form.
The graph shown in Figure 11 shows a clear indication that the cleaning procedure was successful in reducing the background of PFAS compounds to below the 1/3 MRL limit. The trace levels of PFAS targets that were observed were determined to be at very trace levels for all compounds. These results show that the cleaning method given in Appendix A is sufficient to clean the Biotage® PrepXpert-8 system. If lower concentrations are targeted for any of the PFAS compounds, it is suggested to run additional cleaning methods or examine alternative stronger cleaning solvents to help re-establish the system background to the desired levels.
Conclusion
As PFAS regulations continue to evolve, compliance with validated methods such as EPA Method 533 is essential. This study demonstrates that the EVOLUTE® PFAS 533 SPE cartridge, combined with the TurboVap® LV and Biotage® PrepXpert-8 automated extraction platform, delivers a robust, high-throughput workflow that meets and exceeds Method 533 requirements for precision, accuracy, and sensitivity. The results confirm that Biotage® PrepXpert-8 is contamination free and provides consistent, reliable performance, making it an ideal solution for laboratories performing PFAS analysis under EPA Method 533.
Appendix A to F
Access here.
Literature number: AN1021
