By BiotageBiotage
/reversed%20flash%20Bob%20head.png?width=768&name=reversed%20flash%20Bob%20head.png)
What you'll learn
-
The principles governing normal-phase and reversed-phase flash chromatography and how to select the most appropriate mode based on compound properties and purification objectives.
-
How compound chemistry, solubility, stationary phase characteristics, and solvent systems influence chromatographic retention and separation efficiency
-
Systematic approaches to flash chromatography method development, including solvent selection, selectivity optimization, and purification goal setting.
-
Strategies for purifying challenging compound classes, including amines, peptides, and complex natural product extracts.
-
Key considerations for dry loading, column selection, gradient optimization, and scale-up of flash chromatography methods.
-
Best practices for improving purification performance, reproducibility, and overall chromatographic efficiency.
Introduction
Flash chromatography is the preferred purification technique of organic, medicinal, natural product chemists, and more recently peptide chemists because it has the power to separate a broad variety of compounds more efficiently than other crude purification techniques such as crashing out of solution or liquid-liquid extraction. To deliver pure compounds, chemists can manipulate a large variety of variables to accomplish the desired level of purity. This article seeks to explain the factors that ensure successful purifications with flash column chromatography.
For organic and medicinal chemists, flash chromatography is simply part of the synthesis workflow – design the synthesis, perform the synthesis, purify and isolate the desired product or intermediate. Generally, flash chromatography method development gets little thought and chemists rely on the “feel” gained through years of experience for how to purify their synthetic compound mixtures.
Chemists studying natural products face similar but different challenges. Instead of purifying and isolating milligrams to grams of a synthesized target compound, natural product chemists need to screen extracts for their specific needs. Flash chromatography helps by isolating groups of compounds to determine which have the desired activity. When a compound group shows a positive result, flash chromatography is used to separate the individual components for further testing.
Flash chromatography is commonplace in biochemistry research labs where it is used for peptide purification. Flash columns possess higher loading capacity than HPLC columns and purify peptides faster helping advance the development of novel peptide therapeutics.
What follows is information that can be put to use when purifications are more challenging.
Normal-phase or reversed-phase?
The two dominant flash chromatography modes are normal phase and reversed phase. These modes differ in two ways – column media polarity and solvent polarity.
Normal-phase
Normal phase chromatography, sometimes known as straight phase chromatography, uses a polar column media such as silica with non-polar/moderately polar organic solvents. The separation mechanism is adsorption/desorption and compounds are retained based on their adsorptive affinity for the media and are desorbed with increasing solvent polarity. Hence, low polarity compounds elute earlier while those that are more polar are retained longer on the stationary phase.
Normal-phase solvents
Typical normal phase solvent mixtures include hexane (or heptane) + ethyl acetate or dichloromethane + methanol. Other solvent mixtures are used when a different separation (aka alternate selectivity) is needed. Chromatography solvents are classified in various ways to assist with method development but the most frequently utilized are solvent strength and selectivity class, Table 1.
Table 1. Typical normal phase organic solvents and there relative elution strengths and selectivity classes.
|
Solvent |
Polarity |
Selectivity Class |
|
Hexane |
0.01 |
--- |
|
Heptane |
0.01 |
--- |
|
Isooctane |
0.01 |
--- |
|
Toluene |
0.22 |
VII |
|
Dichloromethane |
0.32 |
V |
|
Ether |
0.40 |
I |
|
Ethyl acetate |
0.43 |
VIa |
|
Acetone |
0.50 |
VIa |
|
Acetonitrile |
0.51 |
VIb |
|
THF |
0.53 |
III |
|
Isopropanol |
0.60 |
II |
|
Ethanol |
0.68 |
II |
|
Methanol |
0.70 |
II |
Normal-phase media
While silica is the most commonly used stationary phase for normal phase flash chromatography others include:
- Alumina
- NH2 – bonded silica
- Diol – bonded silica
- CN – bonded silica
Use of these other media is application specific and can often facilitate a separation or eliminate a mass-transfer issue when silica fails.
Table 2. Typical normal phase media, solvents, and applications
|
Media |
Solvents |
Applications |
|
Silica |
Alkane + ethyl acetate or methylene chloride + methanol |
Low to high polarity organic compounds |
|
Alumina |
Alkane + ethyl acetate |
General organic purification, some organic amines |
|
NH2 |
Alkane + ethyl acetate |
Organic bases (3°, 2°, N-heterocyclic) |
|
CN |
Alkane + ethyl acetate Alcohol + water |
Polar organic molecules |
|
Diol |
Alkane + ethyl acetate Alcohol + water |
Polar organic molecules |
Reversed-phase
Reversed phase chromatography is essentially the opposite of normal phase as the name implies. In a reversed phase mode, the column media is non-polar (often silica bonded with an organic alkyl chain like C18) and the solvents are polar. The separation mechanism is solute partitioning between the media and the solvent (think liquid-liquid extraction). Compounds typically (but not always) elute in reversed (hence “reversed phase ”) order compared to normal phase such that more polar compounds are retained less and elute ahead of less polar ones, Figure 1.
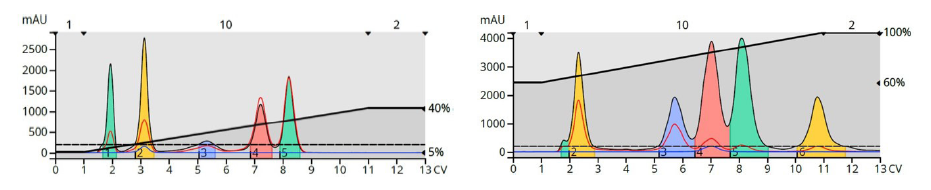
Figure 1. Comparison of normal phase (left) and reversed phase (right) chromatography using the same sample. Normal phase elution order: naphthalene, 1-nitronaphthalene, 3,5-dibenzyloxyacetophenone, butyl paraben, methyl paraben. Reversed phase elution order: methyl paraben, butyl paraben, 1-nitronaphthalene, naphthalene, 3,5-dibenzyloxy acetophenone.
Reversed-phase media
Reversed phase media include covalently bonded octadecyl silane (C18 or ODS), octyl silane (C8), butyl silane (C4) and other similar variations.
Reversed-phase solvents
Solvent systems include water + methanol or water + acetonitrile. If sample components are ionizable or ionic, volatile pH modifiers (formic acid, acetic acid, TFA, ammonium hydroxide, etc.) and/or volatile buffers (ammonium formate, ammonium acetate, etc.) are beneficial and improve separation efficiency and peak shape.
Table 3. Typical reversed phase media, solvents, and applications.
|
Media |
Solvents |
Applications |
|
C18 (ODS) |
Water + methanol or acetonitrile. Add a volatile acid, base, or buffer if compounds are ionic or ionizable in solution |
Low to high polarity organic compounds’ ionizable and ionic compounds; peptides |
|
C8 (Octyl Silane) |
Water + methanol or acetonitrile. Add a volatile acid, base, or buffer if compounds are ionic or ionizable in solution |
Low to medium polarity organic compounds’ ionizable and ionic compounds; peptides |
|
C4 (Butyl Silane) |
Water + methanol or acetonitrile. Add a volatile acid, base, or buffer if compounds are ionic or ionizable in solution |
Low polarity organic compounds’ ionizable and ionic compounds; peptides |
Where to begin – It’s all about chemistry
Getting the desired result with flash chromatography simply boils down to chemistry…
- Sample solubility
» Which is the best solvent for the mixture being purified?
» Is the solvent used to dissolve the crude mixture compatible with the selection of elution solvents? - Targeted compound functional groups
» Is the target compound to be purified
acidic, basic, or neutral?
» Could pH modifiers be needed to optimize mass-transfer kinetics during the separation?
Knowing these variables is a great start to a successful purifica- tion strategy. A great analogy to remember is…
Like Likes Like
Meaning that if your sample components are polar, they will be more attracted to a polar column media (i.e. silica). Likewise, if the compounds are non-polar they will be soluble in non-polar solvents and attracted to hydrophobic media (i.e. bonded silica).
Solubility
Reactions are often performed in an organic solvent but this solvent is not necessarily the best choice to load the crude reaction mixture onto a flash column. If a reaction is performed in a non-polar solvent such as dichloromethane, then normal phase purification using a silica column and a solvent system of an alkane (e.g. hexane) + ethyl acetate is likely the right choice because the reaction reagents have low to moderate polarity.
One could argue the sample components in this example are non-polar, which is likely also true, and therefore should be purified using reversed phase . Absolutely right, reversed phase can be used but what about the sample’s solubility? With reversed phase , compounds should be somewhat soluble in methanol or acetonitrile so they elute from the non-polar media. If not, reversed phase should not necessarily be ruled out, but compound solubility must be evaluated before proceeding.
So, to summarize:
Mixtures containing non-polar, organic soluble target compounds are best purified with normal phase flash chromatography
Mixtures containing polar organic solvent and water-soluble target compounds are best purified with reversed phase flash chromatography.
Compound chemistry (functionality)
Neutral, acidic, basic compounds
For neutral compounds, using solvents without the addition of modifiers is suitable, but what if your compounds have acidic or basic functionality? For separating target compounds that are acidic, adding a small amount of a volatile organic acid (formic, acetic) to the solvent system will help keep the acids protonated and minimize any secondary H-bonding interactions with the silica.
Amines
Organic amines, however, often require a competing amine in the solvent system. Ammonia (in methanol), ammonium hydroxide, and triethyl amine are among the most popular. Since silica is classified as a Brønsted acid, it attracts organic amines, sometimes to extremes causing peak broadening which can impede the ability to satisfactorily separate the mixture.
The addition of an amine in the solvent helps to “neutralize” the silica surface, and will help not only with compound elution, but also with the compound’s recovery or yield.
Organic soluble amines such as N-heterocycles, tertiary, and secondary amines can also be purified using amine- functionalized silica. This type of modified silica eliminates or at least improves the solute-sorbent mass transfer kinetics and removes the need to add a competing amine.
Determining the appropriate stationary phase
A comprehensive infographic to assist with determining the appropriate flash column stationary phase and loading technique is found in Figure 2. To use the flow chart, begin with the upper section (green type), which focuses on solubility and sample chemistry. From this information, it is possible to decide whether normal phase or reversed phase chromatography is most appropriate for a given purification.
If it is determined that normal phase is most appropriate, then the column media should be selected based on the sample’s chemistry. If the target molecule is basic (amine), an amine- bonded silica should be utilized (blue path), but if the molecule is neutral or acidic, then unbonded silica is the best choice (red path).
If the crude mixture containing the target compounds of interest is most soluble in a polar solvent, then reversed phase is an appropriate choice (grey path). Also, if the target compound is of high molecular weight (>1000 da), then using a wide pore reversed
phase media (~ 300 Å) can work successfully (light grey).
Solvent polarity has a major impact on separation performance so using the infographic above is recommended. Additionally, the information in Table 4 is helpful to determine the best option for loading the crude mixture onto the column, knowing if a liquid load is practical or if dry loading should be used.
Dry loading
Dry loading is a sample introduction technique with which a sorbent is mixed with the dissolved sample and then the solvent is evaporated. Dry loading has its advantages which include:
» Improved chromatographic separation
» Increased sample loading
» Potential impurity removal
If the crude mixture is soluble in a strong solvent (one that interferes with compound concentration at the head of the column), dry loading is required or a poor separation outcome (and low target compound purity) can result, Figure 3.
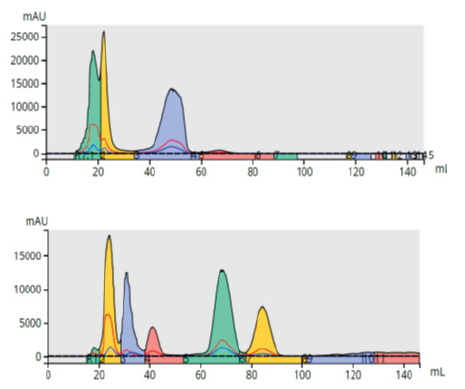
Figure 2. Purification of a reaction mixture using liquid loading (top) and dry loading (bottom). Dry loading removed polar solvent from the reaction mixture enabling more retention and an improved purification.
Table 4. Sample dissolution solvent and flash chromatography mode options. Solubility in some solvents may require dry loading as indicated.
|
Rank |
Solvent Polarity |
Normal Phase |
Recommend Dry Loading |
Reversed Phase |
Recommend Dry Loading |
|
1 |
Dimethyl sulfoxide (DMSO) |
|
|
x |
|
|
2 |
N,N-Dimethylformamide (DMF) |
|
|
x |
|
|
3 |
Water |
|
|
x |
|
|
4 |
Methanol (MeOH) |
|
|
x |
|
|
5 |
Acetonitrile (MeCN) |
|
|
x |
|
|
6 |
Ethanol (EtOH) |
|
|
x |
|
|
7 |
Propanol (PrOH) |
x |
x |
x |
x |
|
8 |
Acetone |
x |
x |
x |
x |
|
9 |
Tetrahydrofuran (THF) |
x |
x |
x |
x |
|
10 |
Ethyl acetate (EtOAc) |
x |
x |
x |
x |
|
11 |
Ether |
x |
|
x |
x |
|
12 |
Methyl chloride (DCM) |
x |
x |
x |
x |
|
13 |
Hexane/Heptane/Alkane |
x |
x |
x |
x |
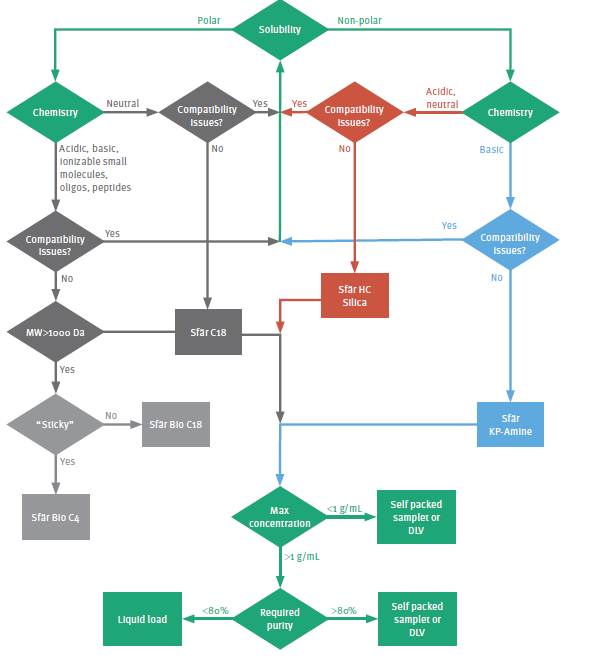
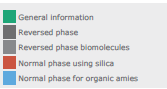
Figure 3. A stationary phase decision matrix to assist with choosing the correct flash column and loading technique.
Table 5. Dry loading media options and their application areas.
|
Media |
Mode |
Application |
|
Silica |
Normal phase |
General purpose, will bind highly polar compounds |
|
Reversed Phase |
Reversed phase, Normal phase |
General purpose, will bind lipophilic compounds in reversed phase but will release all but the most hydrophobic compounds in normal phase |
|
Diatomaceous Earth (Celite®) |
Reversed phase, Normal phase |
General purpose, inert, will release all loaded compounds |
|
Alumina |
Normal phase |
General purpose, less non-specific binding than silica |
|
Florisil® |
Normal phase |
General purpose, less non-specific binding than silica |
|
Amine-bonded Silica |
Reversed phase, Normal phase |
Acts as an acid scavenger; good choice for normal phase organic amine sample loading |
|
Ion Exchange |
Reversed phase, Normal phase |
Acts as ion scavenger (remove ionic/ionizable impurities) or as a catch & release media (concentrates ionic/ionizable component of interest and releases compound later) |
Dry loading also has other uses including impurity removal or scavenging. Ion exchange media is one option for selectively attracting ionic/ionizable compounds (i.e. undesired reaction by-products) that co-elute with the target compound purification.
Dry load sorbent selection is important. Commonly used to remove unwanted particulates from crude mixtures, diatomaceous earth is a media that is chemically inert and allows for the entire sample to elute (think of this material as a sponge). Other media can be chemically interactive and may be useful in removing some impurities (a secondary benefit) or help increase target compound concentration.
Method development and optimization
Once a decision has be made as to which column media and purification mode (normal- or reversed phase ) will work best for the flash separation, the next step is to determine the best separation conditions. The separation method conditions might include the solvent blend ratio and modifiers.
Normal-phase and thin-layer chromatography
Thin layer chromatography (TLC) is one of the better tools applied to developing purification methods. This technique applies to silica, alumina, and polar bonded silica (NH2, diol, CN). With TLC, it is easy to evaluate various solvents in different ratios in parallel in order to determine which provides the best separation.
In normal phase chromatography, separations occur via an adsorption – desorption mechanism. Retention is based on compound polarity where polar compounds have greater affinity for the TLC sorbent than non-polar compounds. Compounds retain on the media until the elution solvent, otherwise known as the mobile phase, desorbs them. Once desorbed, the compounds do not resorb and will migrate unimpeded with the mobile phase.
With TLC, compound retention is determined by the ratio of the compound migration distance divided by the solvent migration difference and is known as Rf (retardation factor). Rf values range from 0 to 1 and correlate well to compound retention in flash chromatography.
Rf = Compound migration distance/Solvent migration difference
Column Volume
In flash chromatography, compound retention is measured in terms of column volumes (CV) rather than time as with gas chromatography (GC) or high performance liquid chromatography (HPLC). The reason for this is 2-fold…
- Using column volumes simplifies any scaling up of flash chromatography methods by eliminating the need to know the column size and flow rate.
- The number of column volumes required to elute a compound from a flash column is proportional to the reciprocal of the compound’s Rf value when using the TLC solvent blend, Table 6.
CV = 1/Rf
Table 6. The CV/Rf relationship.
|
Rf |
CV |
|
0.1 |
10.00 |
|
0.2 |
5.00 |
|
0.3 |
3.33 |
|
0.4 |
2.50 |
|
0.5 |
2.00 |
|
0.6 |
1.67 |
|
0.7 |
1.43 |
|
0.8 |
1.25 |
|
0.9 |
1.11 |
|
1.0 |
1.00 |
The value of using CV for flash chromatography retention measurement is that it is independent of flow rate. Each column size has its own specific CV, which is the empty space within a packed column. Column packing materials are porous so a column volume is equal to the media’s porosity plus the interstitial volume (volume between the media particles).
Solvent choices
Solvents are classified in terms of selectivity and strength. Selectivity relates to a solvent’s ability to separate a pair of compounds while strength deals with retention. Elution methods use a binary mixture of a weak solvent (low strength) and a strong solvent (higher strength than the weak solvent).
Typical flash chromatography solvents are hexane (weak) with ethyl acetate (strong) and dichloromethane (weak) with methanol (strong). To increase compound retention, the solvent blend can be weakened and to decrease retention, the solvent blend can be strengthened.
Table 7. Common flash chromatography solvents by selectivity group and strength.
|
Solvent |
Group |
Strength |
|
Methanol |
II |
0.70 |
|
Ethanol |
II |
0.65 |
|
Propanol |
II |
0.60 |
|
Tetrahydrofuran |
III |
0.53 |
|
Acetone |
VIa |
0.50 |
|
Acetonitrile |
VIb |
0.50 |
|
Ethyl acetate |
VIa |
0.43 |
|
Ether |
I |
0.40 |
|
Dichloromethane |
V |
0.32 |
|
Toluene |
VII |
0.22 |
|
Heptane |
--- |
0.01 |
|
Hexane |
--- |
0.01 |
Selectivity and strength are independent variables. When developing methods it is best to evaluate solvents with different selectivity first followed by a strength adjustment. The selected solvents must be miscible, of course, in order to facilitate a separation.
Selectivity
Selectivity is measured in terms of ΔCV, which is the number of CV between two adjacent compounds on the TLC plate. The larger the ΔCV, the better the separation.
ΔCV = CV1-CV2
Strength
To maximize ΔCV, it is best to set TLC elution conditions where the target compound has an Rf value between 0.15 and 0.4. This is accomplished by adjusting the strong solvent/weak solvent ratio. Rf values decrease when the weak solvent percentage increases, Figure 4.
In this example, a strong solvent blend (left) separates the two compounds on the TLC plate but because the Rf values are high (low retention) there is little retention and minimal separation using flash chromatography.
Changing the TLC solvent mix so that it is weaker allows the two components to retain better on the plate, which decreased their respective Rf values and improved the flash chromatographic separation (middle and right).
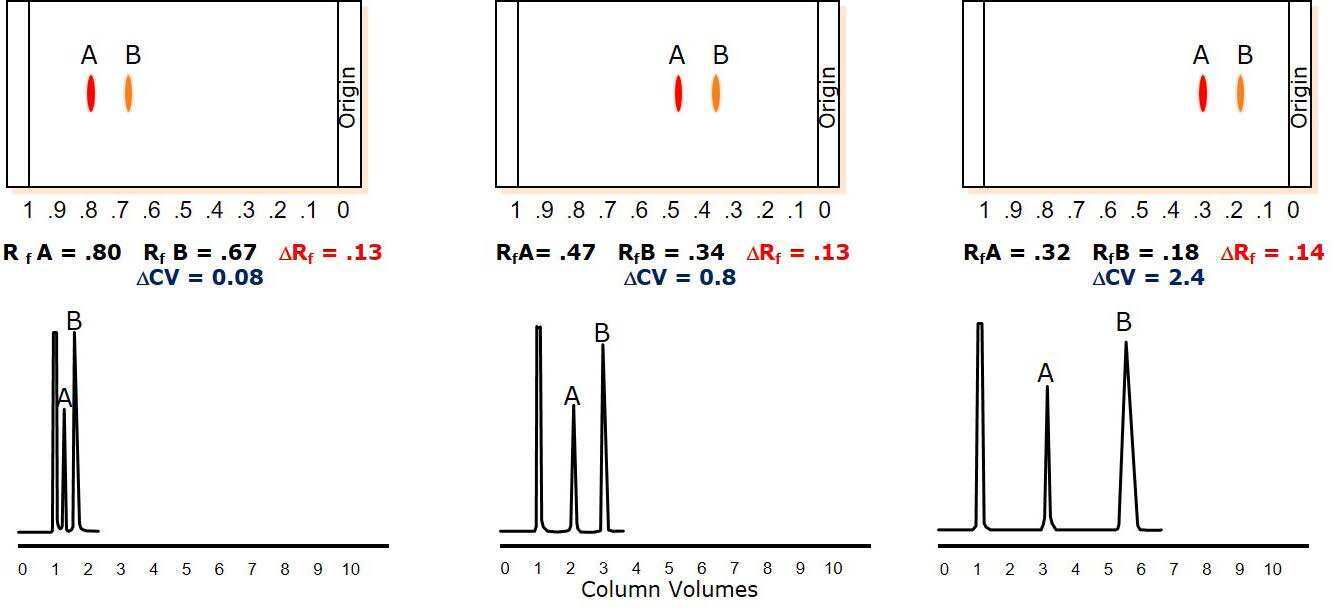
Figure 4. Solvent strength impact on separation performance. Left - strong solvent mixture elutes compounds with high Rf provides minimal separation (ΔCV =0.08), Middle – acceptable solvent strength (one compound within Rf range 0.15 - 0.4) provides a good separation (ΔCV =0.8), Right – optimal solvent conditions for maximum load (ΔCV= 2.4).
Setting purification goals
With this background information, it is possible to begin to examine various solvent blends by TLC to see which will provide the best separation. However, it is up to the chemist to deter- mine the criteria for a successful purification.
With any chromatographic separation, there are three competing variables – speed (flow rate), load (yield), resolution (purity), known as the Chromatographer’s Triangle, Figure 5.
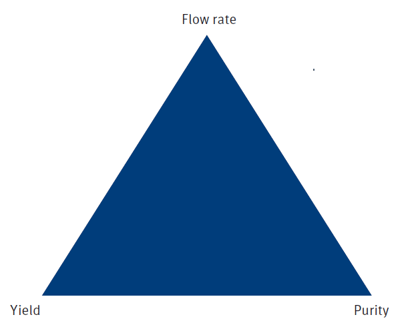
Figure 5. The Chromatographer’s Triangle asks chemists to determine which of the three variables is most important; only two can be optimized.
Before starting on method development, one should know what outcome(s) the purification must achieve – highest purity, highest yield, fastest elution – or any combination of two of these. For synthetic chemists, optimizing purity and/or yield is most important depending on whether the target compound to be purified is an intermediate (yield > purity > speed) or final product (purity > yield > speed).
Most normal phase methods use an alkane solvent (hexane, heptane, isooctane, or cyclohexane) and ethyl acetate. For more polar compounds, dichloromethane and methanol are most often used. Since these solvent mixtures are not always optimal, some experimentation with TLC and other solvents is recommended.
In this example, a 5-component mixture is separated by TLC with three different solvent selectivity classes – hexane/ethyl acetate (class VI), toluene (class VII), and dichloromethane (class V). The TLC solvents all separate the targeted compound
(middle spot) but elute it at different Rf values and with different ΔCV from its nearest impurities. With this example, 100% toluene actually provides the best separation with a maximum ΔCV and an Rf within the optimal range of 0.15–0.40, Figure 6.
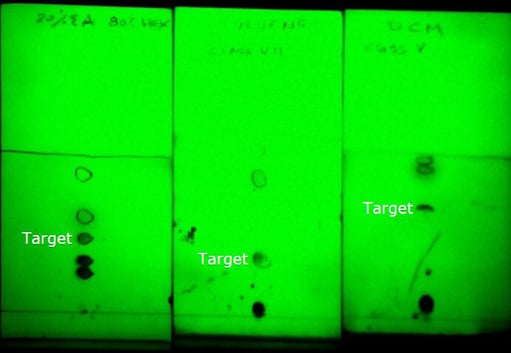
Figure 6. Solvent choice affects the separation selectivity of a 5-component sample mixture. Left - 20% EtOAc/hexane separates the target from its nearest impurities but with a higher Rf and lower ΔCV than what is ideal. Middle - 100% toluene fully isolates the target compound from the other four components with a suitable Rf value, Right – 100% DCM also provides a suitable separation but the target has a high Rf value.
Once a suitable solvent system has been found to separate the targeted compound from the other sample components, it is fine to move forward with using flash chromatography.
Elution modes
- Isocratic
As previously mentioned, TLC methods translate to flash chromatography well when the same solvents are used at the same ratio. This is an elution mode known as Isocratic. With isocratic elution, the mixture’s components will elute in a predictable number of column volumes (refer to Table 6). For example, if a compound has an Rf of 0.2, it will require 5 CV to elute. Likewise, a compound with an Rf of 0.4 requires 2.5 CV to elute.
Isocratic methods are very good with simple purifications but low Rf (well retained) compounds elute in broad bands diluted in a lot of solvent, Figure 7. This can negatively affect detection, purity, and yield.
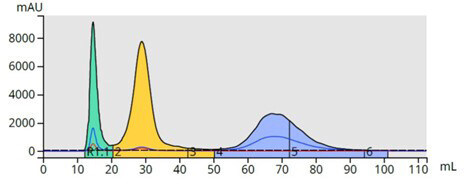
Figure 7. Isocratic elution method separated the three compounds but with major increases in peak volume which can impact sensitivity, purity, and yield.
- Linear Gradient
Purification improves when the TLC method is converted to a linear gradient. With a linear gradient, the mass-transfer or adsorption-desorption kinetics are altered during the purification process. At the beginning of the gradient, a solvent ratio weaker than the TLC solvent blend is used but is changed, linearly, over time by increasing the strong solvent percentage. Early eluting (high Rf) compounds are retained more and separated better than with an isocratic elution and lower Rf compounds elute in higher concentration which enables detection and fractionation, Figure 8.
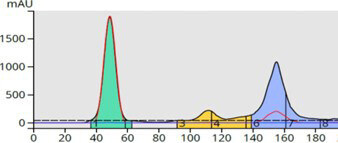
Figure 8. Linear gradient purification increased the separation between compounds 1 and 2 and eluted compound 3 in less volume thereby increasing its sensitivity and recovery.
Also, an impurity has become visible between peaks 2 and 3 that was not easily seen with the isocratic run.
The gradient slope influences both the separation quality and purification time so this needs evaluation. However, a good, reliable algorithm to use when converting a TLC method to a linear gradient is…
1/4 of the TLC strong solvent %, hold 1 CV
1/4 TLC strong solvent to 2x strong solvent % over 10 CV 2x TLC strong solvent %, hold 2 CV
Therefore, when we put the algorithm to use, a TLC method using 20% ethyl acetate (strong solvent) with 80% hexane converts to the following linear gradient method, Figure 9.
- 5% ethyl acetate for 1 CV
- 5% to 40% ethyl acetate over 10 CV
- 40% ethyl acetate for 2 CV
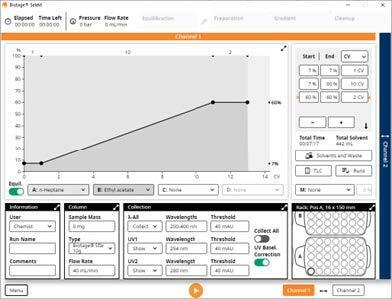
Figure 9. TLC-based linear gradient. The TLC strong solvent % was 30 which converts to a linear gradient of 7-60% over 10 column volumes (CV).
Linear gradients using this algorithm to elute all compounds with an Rf of 0.1 and higher.
- Step Gradient
There are times where a linear gradient fails to achieve the purification goals due to a less than ideal separation between the target compound and its nearest impurity, or a poor load capacity, or possibly to address a desire to less solvent and be a bit greener. In these cases, a step gradient may be the better option.
Step gradients are comprised of a series of isocratic segments. Methods built with discrete steps can provide selective compound elution, increase sample load, and decrease solvent consumption. Figure 10 shows how a step gradient shortened the separation and reduced the volume between eluting peaks all while improving the overall separation compared to both the isocratic and linear gradient runs.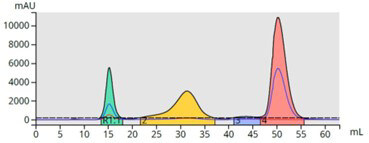
Figure 10. Step gradient elution optimized the separation of the three major compounds and the by-product and used less solvent and time than the other methods.
Step gradients can be challenging to develop, however. In the above example, after some trial and error, a gradient starting with 20% strong solvent (TLC was 30%) and increasing in 10% steps of two CV each was successful. Other separations will likely require different steps, both in height and length. So, often these gradients are most effective when a large amount (>10 grams) of material needs purification.
TLC can assist with step gradient building as well but this process does require a flash system suitably equipped with a “TLC to step gradient” function. The separation, solvent consumption, and sample load all typically improve with a step gradient, Figure 12.
With a step gradient, purification strategy is optimized, and the trade-offs mentioned earlier with the Chromatographer’s Triangle, are minimized.
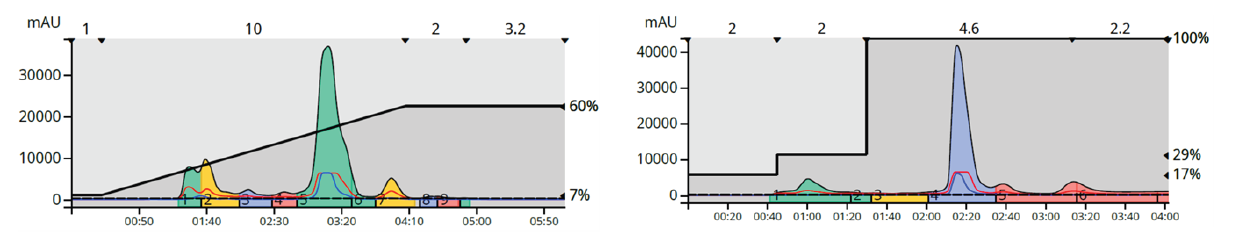
Figure 11. Using a step gradient provided a separation of the trailing shoulder from the product and reduced run time by over 30% as well.
Organic Amines
Organic soluble amines pose a different challenge to chemists, especially if they have basicity. Lewis bases interact strongly with silica gel, which is a weak acid, making them difficult to elute and separate without introduction of a competing amine to the solvent system as a modifier. A competing amine helps to neutralize the acidic silica surface, which enables the basic amines to elute.
The typical solvent system used to purify these types of compounds on silica is a dichloromethane (DCM)/methanol (MeOH) gradient incorporating a small amount (on the order of 0.05 to 0.2%) competing amine (ammonium hydroxide, ammonia in MeOH, triethylamine, diethylamine, among others). Optimizing the separation conditions, however, still can be challenging as small changes in mobile phase polarity (MeOH or amine modifier) can often cause target amine compounds to elute very quickly without separating.
Other organic purification options include alumina and amine- functionalized silica. While alumina is a more amine-friendly media than silica, its large particle size (~150 µm) minimizes its usefulness. Amine-functionalized silica, on the other hand, is a silica bonded phase (~50 µm), and provides better separations.
The amine functionality takes the place of the competing amine in the mobile phase and simplifies the chromatography, Figure 13. Usual mobile phases include hexane/ethyl acetate or ethyl acetate/IPA for polar amines.
Reversed-phase
Prior to using a new reversed phase flash column for method development or purification, it needs conditioning. Why?
Because reversed phase flash columns are dry and require pre-conditioning or wetting with solvents in order for them to function properly.
Reversed-phase column conditioning
The wetting process is simple and quick entailing only three steps.
- Flush the column with 100% organic solvent (ACN or MeOH) for 3-5 column volumes (CV)
- Flush with 50% organic solvent (ACN or MeOH)/50% aqueous for 3-5 column volumes (CV)
- Flush with your initial gradient blend for 3-5 column volumes (CV)
Once a column is conditioned, this process does not need repeating.
Method development
Reversed phase method development usually does not involve TLC for a variety of reasons including TLC media wettability limitations, sample loading limitations, and mass-transfer kinetics. It is best to develop reversed phase flash chromatography methods with an HPLC column (preferably packed with the same flash chromatography media as your flash column) or on a reversed phase flash column through trial and error.
This process need not be long and tedious but does require an understanding of the potential ionizability your target compound and by-products may possess in solution.
Neutral compounds are separable using gradients of either water + methanol (MeOH) or water + acetonitrile (ACN). Ionic and ionizable compounds, however, require addition of either an organic buffer or pH modifier (acid or base) to the mobile phase to suppress ionization and improve the solutes’ mass transfer kinetics, Table 8.
Table 8. List of solvent modifiers for ionic and ionizable compounds.
|
Additive |
Concentration |
Application |
|
Formic acid |
0.1% |
Organic acids, ionizable hydroxyl groups, peptides |
|
Acetic acid |
0.1% |
Organic acids, ionizable hydroxyl groups, peptides |
|
Trifluoroacetic acid |
0.1% |
Organic acids, ionizable hydroxyl groups, peptides |
|
Ammonium Hydroxide |
0.1% |
Organic amines, Lewis bases |
|
Triethylamine |
0.1% |
Organic amines, Lewis bases |
|
Ammonium formate |
100 mM |
Ionic compounds, zwitterions |
|
Ammonium acetate |
100 mM |
Ionic compounds, zwitterions |
With reversed phase chromatography, the separation mechanism is solute partitioning between the mobile phase and the non-polar stationary phase. Compounds retain on the
stationary phase and elute based on their hydrophobicity. Ionic or ionizable compounds also follow this mechanism but their ionization level, Figure 14, influences retention and peak shape.
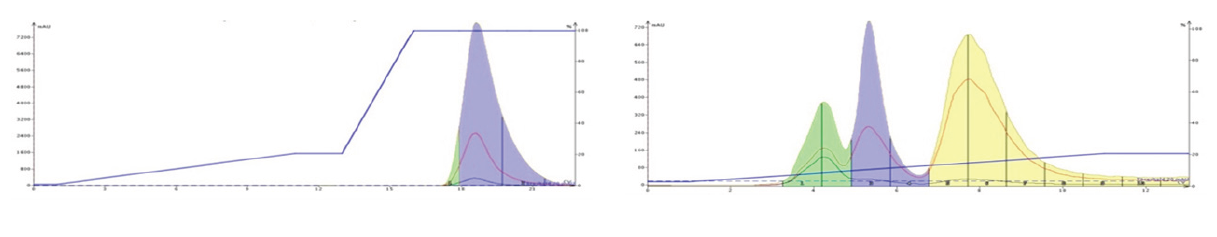
Figure 12. Purification of three tricyclic amines using silica with a DCM/MeOH gradient (left) and an amine bonded silica column (Biotage® Sfär KP-Amine) with a hexane/EtOAc gradient (right).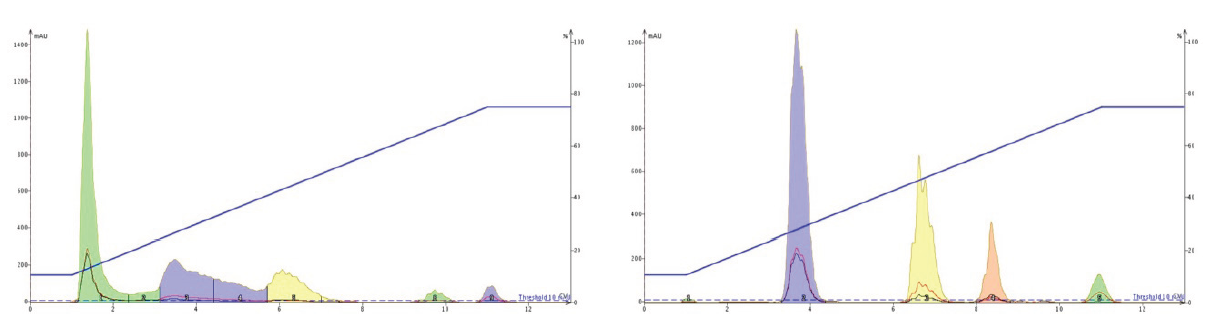
Figure 13. Reversed phase flash chromatography showing the impact of mobile phase buffering on a mix of ionic food colourings. Left – no added buffer. Right – 100 mM ammonium acetate, pH 7, added to mobile phase during the gradient. Compound elution order – yellow 5 (tartrazine), red 40 (Allura red AC), blue 1 (brilliant blue FCF), red 3 (erythrosine).
For most sample mixtures, reversed phase compound elution order is exactly opposite that of normal phase (hence the term “reversed phase ”). As mentioned earlier, with reversed phase, compounds elute based on the differences in hydrophobicity. The normal phase chromatographic mechanism is adsorption/ desorption and not always based on polarity differences. This is an important distinction because if you need to convert a normal phase method to a reversed phase method (or vice- versa), the reversed phase elution order may not always be the exact reverse of the normal phase elution order, Figure 15.
Peptides
Peptide purification using reversed phase flash chromatography is gaining in popularity due to the improved loading capacity resulting from high performance silica columns, purification speed and simplicity, and cost compared to preparative HPLC. High performance flash columns designed specifically for peptides (20 µm particles with ~300Å pores) provide comparable performance to prep HPLC at a lower cost.
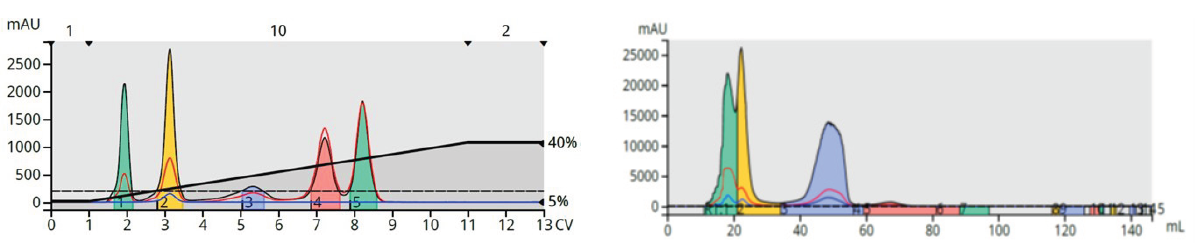
Figure 14. Example of non-predictable reversed phase elution order based on normal phase elution order. Left – normal phase separation (elution order naphthalene, 1-nitronaphthalene, 3, 5-dibenzyloxyacetophenone, butyl paraben, methyl paraben). Right – reversed phase separation (elution order methyl paraben, butyl paraben, 1-nitronaphthalene, naphthalene, 3, 5-dibenzyloxyacetophenone).
To ensure the peptides retain and separate, shallow gradients of water, ACN, and an acid (formic, acetic, trifluoroacetic (TFA)) are common. The added acid ensures the peptides are protonated, which helps with their retention and selectivity.
With most peptide syntheses, there are impurities, many of which are deletion sequences missing one or more amino acids compared to the synthesized peptide. Because the
peptides are larger in size (>1000 mW) compared to other small molecules (up to 1000 MW), the deletion sequences often have similar hydrophobicity to the main peptide making purification challenging, Figure 16.
Incorporating the acidified, shallow gradients with high- performance flash columns with larger pore diameter (~300Å) does improve purification efficacy in terms of both peptide purity and yield.
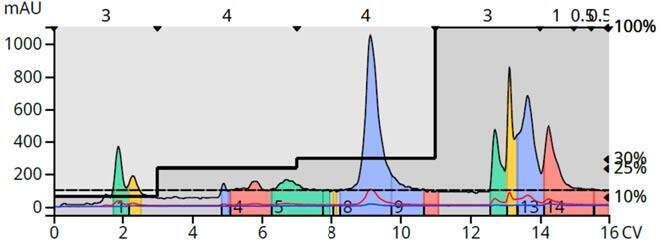
Figure 15. 10-mer peptide purification using a 10-gram Sfär Bio C18 flash column and an acetonitrile/water/formic acid step gradient. The peptide eluted at ~ 5:30.
Scaling up
Scaling purification methods is not difficult as long as important parameters are maintained.
- Sample concentration
- Sample dissolution solvent
- Sample introduction method (liquid/dry)
- Column stationary phase/media
- Solvent flow linear velocity
The variable to be controlled is flow rate. All of the other parameters listed are scalable based on column volume or column media mass ratios. These ratios or scale factors (SF) are easily determined.
SF = CV(Lg)/CV(Sm)
or
SF = (Column Mass(Lg))/(Column Mass(Sm))
Where L = the larger column and S = the smaller column.
As an example, a 25-gram column has 2.5 times the silica and volume that a 10-gram column has so the scale factor is 2.5.
SF = 25/10 = 2.5
For scale up this means that 2.5 times more sample mass can be purified using a 25-gram column compared to a 10-gram column.
Figure 16 shows a direct, linear scale up of a 7-component mixture using scaling factors. The 12-gram cartridge scale factor is 1, since that is the starting point or small column. The 60-gram column has a scale factor of 10 and the 400-gram column has a scale factor of 33.3. Table 9 provides scale factors from 5-gram to 40 kilogram columns.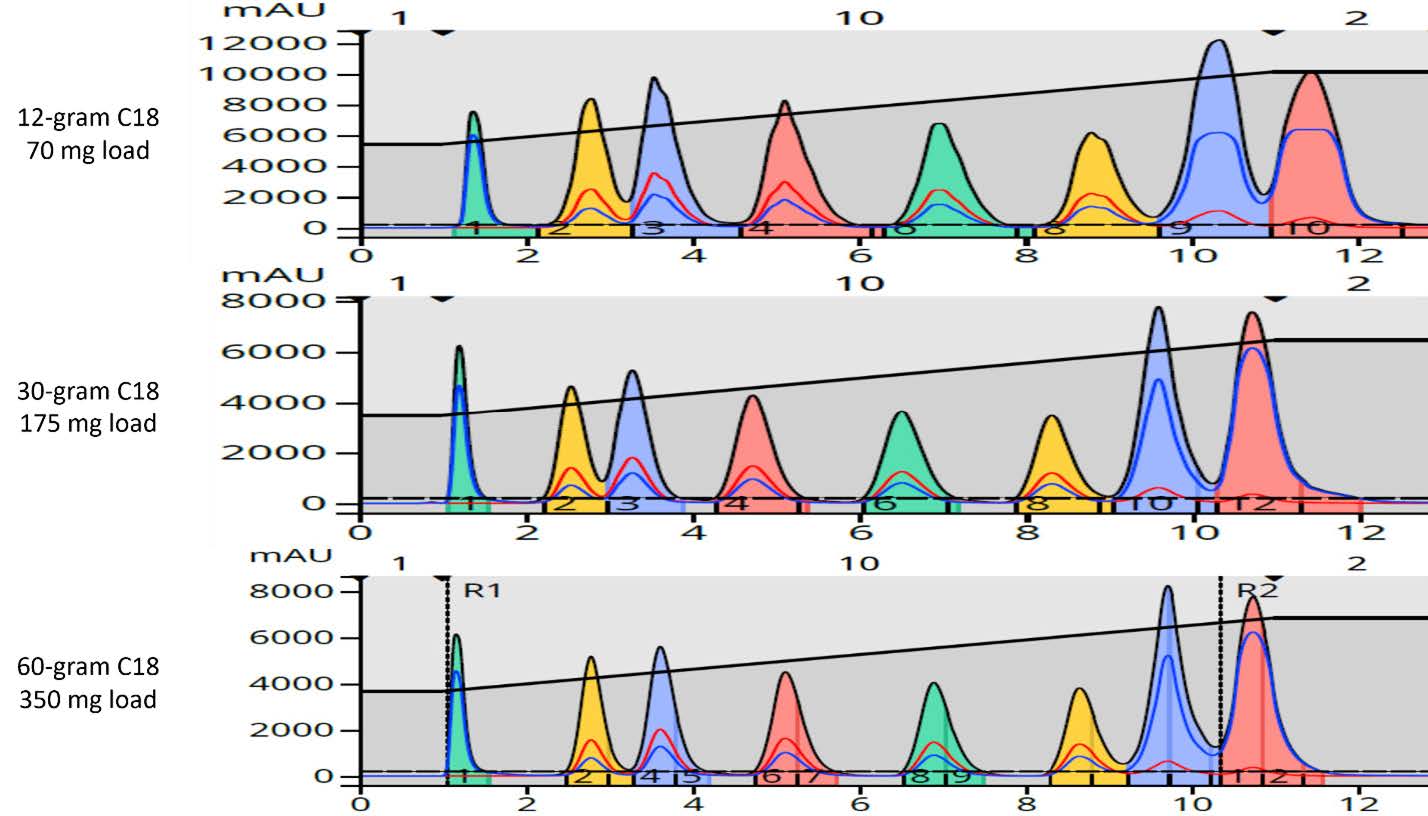
Figure 16. Direct, 10-fold purification scale-up. Top - 35 mg load on a 6-gram Sfär C18. Bottom – 350 mg load on a 60-gram Sfär C18.
Table 9. Purification scale factors from 5 g to 40 kg columns.
|
Column Size (g) |
5 |
10 |
25 |
50 |
100 |
200 |
350 |
750 |
1500 |
2500 |
5000 |
20000 |
40000 |
|
5 |
1 |
2 |
5 |
10 |
20 |
40 |
70 |
150 |
300 |
500 |
1000 |
4000 |
8000 |
|
10 |
|
1 |
2.5 |
5 |
10 |
20 |
35 |
75 |
150 |
250 |
500 |
2000 |
4000 |
|
25 |
|
|
1 |
2 |
4 |
8 |
14 |
30 |
60 |
100 |
200 |
800 |
1600 |
|
50 |
|
|
|
1 |
2 |
4 |
7 |
15 |
30 |
50 |
100 |
400 |
800 |
|
100 |
|
|
|
|
1 |
2 |
3.5 |
7.5 |
15 |
25 |
50 |
200 |
400 |
|
200 |
|
|
|
|
|
1 |
1.75 |
3.75 |
7.5 |
12.5 |
25 |
100 |
200 |
|
350 |
|
|
|
|
|
|
1 |
2.1 |
4.3 |
7.1 |
14.3 |
57 |
114 |
|
750 |
|
|
|
|
|
|
|
1 |
2 |
3.3 |
6.6 |
27 |
54 |
|
1500 |
|
|
|
|
|
|
|
|
1 |
1.7 |
3.4 |
13.3 |
26 |
|
2500 |
|
|
|
|
|
|
|
|
|
1 |
2 |
8 |
16 |
|
5000 |
|
|
|
|
|
|
|
|
|
|
1 |
4 |
8 |
|
20000 |
|
|
|
|
|
|
|
|
|
|
|
1 |
2 |
|
40000 |
|
|
|
|
|
|
|
|
|
|
|
|
1 |
Linear velocity
As previously mentioned, flow rates are not directly scalable so to maintain the same mass transfer kinetics, and therefore, separation performance, it is important to maintain solvent flow linear velocity. To determine the linear velocity, there are two calculations required.
The first equation determines the time required for a non-retained compound to elute and requires knowledge of the column’s volume or CV. The CV values are often provided by column manufactures.
Void time (min) = (Column volume (mL))/(Flow rate (mL/min))
The second calculation determines the linear velocity in cm/min and uses the column’s packed bed depth in the equation. Most column manufacturers supply this information as well. Table 10 provides a listing of Biotage flash cartridges (silica), their column volumes, and packed bed depths.
Linear velocity (cm/min) = (Bed depth (cm))/(Void time (min))
To make use of the linear velocity data, ensure the large column provides a similar linear velocity as used with the small column.
Small column = Biotage® Sfär HC 10 gram with a CV of 17 mL and a bed depth of 5.5 cm. If the method ran at 20 mL/min, this column’s void time was
Void time = (17 mL)/(20 mL/min) = 0.85 min
and its linear velocity was
Linear velocity = (5.5 cm)/(0.85 min) = 6.47 cm/min
If scaling up to a 100-gram column, calculate the flow rate, which provides the same linear velocity as the small column. Use the larger column’s CV and bed depth as well as the smaller column’s linear velocity.
Large column = Biotage® Sfär HC 100 gram with a CV of 180 mL and a bed depth of 15.7 cm, see Table 10.
To determine the flow rate to match linear velocity, multiply the larger column’s CV by the ratio of the small column’s linear velocity and the large column’s bed depth, or
Flow rate (Lg) = CV (Lg)*( (Linear velocity (Sm))/(Bed depth (Lg)))
For this example
Flow rate (Lg) = 180*(6.47/15.7) = 74 mL/min
Using these equations, determining linear velocity and required larger column flow rate are simplified and ensure matching chromatographic results.
Table 10. Biotage silica flash cartridge column volume and bed depth data by style and media.
|
Part Number |
Column |
Media |
Particle Size (µm) |
Media Quantity (g) |
ID (cm) |
Length (cm) |
Column Volume (mL) |
|
FSRD-0445-0005 |
Biotage® Sfär Silica D Duo 60 µm 5 g |
Silica |
60 |
5 |
1.64 |
4.42 |
9 |
|
FSRD-0445-0010 |
Biotage® Sfär Silica D Duo 60 µm 10 g |
Silica |
60 |
10 |
2.08 |
5.50 |
15 |
|
FSRD-0445-0025 |
Biotage® Sfär Silica D Duo 60 µm 25 g |
Silica |
60 |
25 |
2.91 |
7.40 |
42 |
|
FSRD-0445-0050 |
Biotage® Sfär Silica D Duo 60 µm 50 g |
Silica |
60 |
50 |
3.90 |
7.91 |
80 |
|
FSRD-0445-0100 |
Biotage® Sfär Silica D Duo 60 µm 100 g |
Silica |
60 |
100 |
3.90 |
15.75 |
150 |
|
FSRD-0445-0200 |
Biotage® Sfär Silica D Duo 60 µm 200 g |
Silica |
60 |
200 |
5.88 |
14.60 |
310 |
|
FSRD-0445-0350 |
Biotage® Sfär Silica D Duo 60 µm 350 g |
Silica |
60 |
350 |
5.88 |
24.60 |
530 |
|
|
|
|
|
|
|
|
|
|
FSRS-0445-0005 |
Biotage® Sfär Silica 60 µm 5 g |
Silica |
60 |
5 |
1.64 |
4.42 |
9 |
|
FSRS-0445-0010 |
Biotage® Sfär Silica 60 µm 10 g |
Silica |
60 |
10 |
2.08 |
5.50 |
15 |
|
FSRS-0445-0025 |
Biotage® Sfär Silica 60 µm 25 g |
Silica |
60 |
25 |
2.91 |
7.40 |
42 |
|
FSRS-0445-0050 |
Biotage® Sfär Silica 60 µm 50 g |
Silica |
60 |
50 |
3.90 |
7.91 |
80 |
|
FSRS-0445-0100 |
Biotage® Sfär Silica 60 µm 100 g |
Silica |
60 |
100 |
3.90 |
15.75 |
150 |
|
FSRS-0445-0200 |
Biotage® Sfär Silica 60 µm 200 g |
Silica |
60 |
200 |
5.88 |
14.60 |
310 |
|
FSRS-0445-0350 |
Biotage® Sfär Silica 60 µm 350 g |
Silica |
60 |
350 |
5.88 |
24.60 |
530 |
|
|
|
|
|
|
|
|
|
|
FSUD-0443-0005 |
Biotage® Sfär Silica HC D High Capacity Duo 20 µm 5 g |
Silica |
20 |
5 |
1.64 |
4.42 |
9 |
|
FSUD-0443-0010 |
Biotage® Sfär Silica HC D High Capacity Duo 20 µm 10 g |
Silica |
20 |
10 |
2.08 |
5.50 |
15 |
|
FSUD-0443-0025 |
Biotage® Sfär Silica HC D High Capacity Duo 20 µm 25 g |
Silica |
20 |
25 |
2.91 |
7.40 |
42 |
|
FSUD-0443-0050 |
Biotage® Sfär Silica HC D High Capacity Duo 20 µm 50 g |
Silica |
20 |
50 |
3.90 |
7.91 |
80 |
|
FSUD-0443-0100 |
Biotage® Sfär Silica HC D High Capacity Duo 20 µm 100 g |
Silica |
20 |
100 |
3.90 |
15.75 |
150 |
|
FSUD-0443-0200 |
Biotage® Sfär Silica HC D High Capacity Duo 20 µm 200 g |
Silica |
20 |
200 |
5.88 |
14.60 |
310 |
|
FSUD-0443-0350 |
Biotage® Sfär Silica HC D High Capacity Duo 20 µm 350 g |
Silica |
20 |
350 |
5.88 |
24.60 |
530 |
|
|
|
|
|
|
|
|
|
|
FSUS-0443-0005 |
Biotage® Sfär Silica HC High Capacity 20 µm 5 g |
Silica |
20 |
5 |
1.64 |
4.42 |
9 |
|
FSUS-0443-0010 |
Biotage® Sfär Silica HC High Capacity 20 µm 10 g |
Silica |
20 |
10 |
2.08 |
5.50 |
15 |
|
FSUS-0443-0025 |
Biotage® Sfär Silica HC High Capacity 20 µm 25 g |
Silica |
20 |
25 |
2.91 |
7.40 |
42 |
|
FSUS-0443-0050 |
Biotage® Sfär Silica HC High Capacity 20 µm 50 g |
Silica |
20 |
50 |
3.90 |
7.91 |
80 |
|
FSUS-0443-0100 |
Biotage® Sfär Silica HC High Capacity 20 µm 100 g |
Silica |
20 |
100 |
3.90 |
15.75 |
150 |
|
FSUS-0443-0200 |
Biotage® Sfär Silica HC High Capacity 20 µm 200 g |
Silica |
20 |
200 |
5.88 |
14.60 |
310 |
|
FSUS-0443-0350 |
Biotage® Sfär Silica HC High Capacity 20 µm 350 g |
Silica |
20 |
350 |
5.88 |
24.60 |
530 |
Table 11. Amine and reversed-phase columns
|
Part Number |
Column |
Media |
Particle Size (µm) |
Media Quantity (g) |
ID (cm) |
Length (cm) |
Column Volume (mL) |
|
FSAD-0909- 0005 |
Biotage® Sfär KP-Amino D ¬ Duo 50 µm 5 g |
Amine |
50 |
5 |
1.64 |
4.3 |
9 |
|
FSAD-0909- 0011 |
Biotage® Sfär KP-Amino D ¬ Duo 50 µm 11 g |
Amine |
50 |
11 |
2.00 |
5.6 |
15 |
|
FSAD-0909- 0028 |
Biotage® Sfär KP-Amino D ¬ Duo 50 µm 28 g |
Amine |
50 |
28 |
3.02 |
7.5 |
33 |
|
FSAD-0909- 0055 |
Biotage® Sfär KP-Amino D ¬ Duo 50 µm 55 g |
Amine |
50 |
55 |
3.94 |
7.8 |
66 |
|
FSAD-0909- 0110 |
Biotage® Sfär KP-Amino D ¬ Duo 50 µm 110 g |
Amine |
50 |
110 |
3.94 |
15.8 |
132 |
|
FSAD-0909- 0220 |
Biotage® Sfär KP-Amino D ¬ Duo 50 µm 220 g |
Amine |
50 |
220 |
5.92 |
14.5 |
264 |
|
FSAD-0909- 0380 |
Biotage® Sfär KP-Amino D ¬ Duo 50 µm 380 g |
Amine |
50 |
380 |
5.92 |
25.0 |
510 |
|
|
|
|
|
|
|
|
|
|
FSUD-0401- 0006 |
Biotage® Sfär C18 D ¬ Duo 100 Å 30 µm 6 g |
C18 |
28 |
6 |
1.64 |
4.3 |
9 |
|
FSUD-0401- 0012 |
Biotage® Sfär C18 D ¬ Duo 100 Å 30 µm 12 g |
C18 |
28 |
12 |
2.00 |
5.6 |
17 |
|
FSUD-0401- 0030 |
Biotage® Sfär C18 D ¬ Duo 100 Å 30 µm 30 g |
C18 |
28 |
30 |
3.02 |
7.5 |
45 |
|
FSUD-0401- 0060 |
Biotage® Sfär C18 D ¬ Duo 100 Å 30 µm 60 g |
C18 |
28 |
60 |
3.94 |
7.8 |
85 |
|
FSUD-0401- 0120 |
Biotage® Sfär C18 D ¬ Duo 100 Å 30 µm 120 g |
C18 |
28 |
120 |
3.94 |
15.8 |
164 |
|
FSUD-0401- 0240 |
Biotage® Sfär C18 D ¬ Duo 100 Å 30 µm 240 g |
C18 |
28 |
240 |
5.92 |
14.5 |
328 |
|
FSUD-0401- 0400 |
Biotage® Sfär C18 D ¬ Duo 100 Å 30 µm 400 g |
C18 |
28 |
400 |
5.92 |
25.0 |
582 |
Summary
Successful flash chromatography begins with understanding your sample and defining your purification goals. Method development does not need to be complex, but investing time in selecting the appropriate stationary phase, solvent system, and loading strategy can significantly improve purification performance
Literature number: PPS490
