Biotage C18 PhyTip® column benefits
- Bind a Wide Range of Sizes of Protein/Peptide Sizes
- Exhibit a High Absolute Binding Capacity
- Process Results in Low Loss of Peptide Sample
- Compatible with many common mass spectrometry solvents
Introduction
Biotage has developed an automated process to desalt or “clean-up” proteins/peptides using C18 PhyTip® columns for use in mass spectrometry (MS) analysis. PhyTip columns bind proteins/peptides through reverse-phase solid phase extraction (SPE), which utilizes long carbon chain C18 resin to capture and separate peptides based on their hydrophobicity.
The PhyTip column is composed of C18 resin retained on a pipette tip by two thin, inert frit screens. Depending on the downstream assay, the PhyTip column can be made with either 90 Å or 300 Å pore resin in a 5 µL bed and has capacity to process up to 200 µL of solution. The PhyTip column processes peptides through dual flow chromatography, a systematic process of back and forth sample flow performed by a liquid handler that controls the volume and flow rates.
Because this reversed phase chromatography process utilizes volatile organic solvents, the liquid handler has been programmed to minimize sample loss. When preforming a reversed phase purification using a manual pipette or a semi-automatic electronic pipette, back pressure in aspirating solutions can cause an inconvenience to the operator and inconsistencies within results. The method described in this note has been developed to overcome any issues with backpressure to ensure each sample is processed in the same way and result in consistent recovery. As a result, the method can be utilized to clean-up small to mid-scale peptide samples (up to 96 at a time) for use in matrix-assisted laser desorption- ionization (MALDI) or electrospray ionization (ESI) mass spectrometry as part of an automated process.
Method
Sample processing on the Biotage MEA2 personal purification system
- Sample prepared to a 0.1 % Trifluoroacetic Acid (TFA) concentration
- Wetting with 100 µL 100% Acetonitrile (ACN) for 4 cycles
- Equilibration with 100 µL 0.1 % TFA for 1 cycle
- Capture with 185 µL sample for 4 cycles
- Wash with 100 µL of 0.1 % TFA for 1 cycle
- Elution with 100 µL of 70% ACN + 0.1 % TFA for 4 cycles
Each cycle consists of one aspiration and one expulsion at a flow rate of 1 mL/min. Each elution aspirate/expel step is performed in 4 increments with 5 second pauses, while all other aspirate/expel steps are performed in 8 increments with 30 second pauses. The processing was designed to imitate manual pipetting while compensating for backpressure. The elution plate is sealed to prevent the volatile elution buffer from evaporating during the processing period, and solutions were vacuum degassed to further ensure air does not enter the column.
Sample analysis
Recovered samples were qualitatively assessed on a 16% Novex Tricine Protein Gel. Gel was loaded with samples and a protein molecular weight standard (Sigma), and run for 70 minutes at 125 V. The protein gel was then fixed with 5% glutaraldehyde for one hour and stained with SimplyBlue SafeStain (Thermo) for another hour.
Samples were quantified via nanodrop absorbance readings at 280 nm for non-fluorescent proteins, 470 nm for eGFP, and 395 nm for Cytochrome C quantification. (TFA causes unfolding of Cytochrome C, shifting absorbance to 395 nm) A standard curve was generated for both eGFP and Cytochrome C absorbance.
Results
C18 PhyTip® columns bind a wide range of protein/ peptide sizes
Sigma Ultra-Low Range Protein Molecular Weight Marker was purified using the C18 PhyTip® columns using the method described above in order to test the columns capacity in purifying varying sizes of proteins/peptides. The samples were quantified through absorbance and visualized on a protein gel. The image below (Figure 1) displays the processed protein ladder and unprocessed protein ladder on a protein gel. Both types of C18 PhyTip columns were able to recover all sizes of protein/peptides which ranged from 1 kDa to 26.6 kDa.
A sample of concentrated eGFP with a molecular weight of 32.7 kDa was also processed through the columns. The recovered samples contained only a fraction of the eGFP applied to the column. As a result, the PhyTip columns are selective towards small hydrophobic proteins or peptides.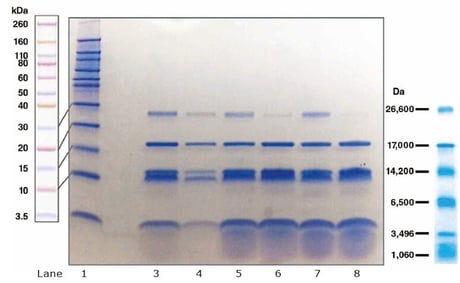
Figure 1. Tricine protein gel
Two sets of low weight protein marker were processed by each type of C18 PhyTip® column (90 Å and 300 Å). 5 µL of each recovered sample was run on a 16% tricine protein gel and stained with SimplyBlue SafeStain.
Lane 1: Novex high range protein ladder (Thermo). Lane 2&4: Protein ladder samples 1 and 2 (respectively) processed by the 90 Å resin columns. Lane 3&5: Protein ladder samples 1 and 2 (respectively) processed by the 300 Å resin columns Lane 6: Unprocessed low range protein ladder Lane 7: A 1:2 dilution of unprocessed low range protein ladder.
|
Resin Pore |
90 Å |
300 Å |
|
Starting (µg) |
76.4 |
76.4 |
|
Yield (µg) |
5.44 |
9.86 |
|
CV (n=3) |
2.12% |
7.95% |
|
% Recovery |
7.12% |
12.9% |
Table 1. eGFP binding capacity
Purified eGFP was spiked into a 0.1% TFA solution and processed through the PhyTip® C18 column. The protein was quantified with a 470 nm absorbance reading via nanodrop.
C18 PhyTip® columns exhibit a high absolute binding capacity
A concentrated sample of Cytochrome C (from equine heart) was processed to saturate the C18 PhyTip columns in order to measure their binding capacity. After the MEA processed the samples, the amount of protein in the flow-through was quantified in order to determine how much protein had bound to the column through observing how much protein had not bound after capture. The capacity of the 90 Å resin is about 19.25 µg of peptide per µL of resin, while the 300 Å resin is about 16.90 µg of peptide per µL of resin.
|
Resin Pore |
90 Å |
300 Å |
|
Starting ( µg) |
233 |
182 |
|
Flow-Through (µg) |
149 |
85.6 |
|
Yield (µg) |
58.5 |
38.6 |
|
% Recovery |
25.1% |
21.2% |
|
Capacity (µg) |
84.3 |
96.3 |
|
CV (n=3) |
6.20% |
5.37% |
Table 2. PhyTip® column binding capacity
Binding capacity of the PhyTip C18 columns was measured by quantifying an amount of Cytochrome C that was processed through the columns. The amount of bound protein was calculated with a known starting concentration and by measuring the flow through of sample.
C18 PhyTip® columns processing results in low loss of peptide sample
In order to test the level of sample loss during processing, the recovery of Cytochrome C when processed with the manual C18 ZipTip (Sigma) was compared to the automatic processing of the C18 PhyTip® column. When applying a small quantity of Cytochrome C to the PhyTip® column in comparison to the ZipTip, the recovery of the PhyTip C18 column sample is comparable.
|
Resin |
90 Å |
300 Å |
ZipTip |
|
Start (µg) |
7.05 |
7.05 |
1.35 |
|
Yield (µg) |
5.89 |
5.72 |
1.12 |
|
STD (µg) |
0.780 |
0.440 |
- |
|
CV (n=3) |
13.2% |
7.62% |
- |
|
% Recovery |
83.6% |
81.2% |
83.3% |
Table 3. PhyTip column recovery
A minimal amount of Cytochrome C was processed through both resin pore sized PhyTip® columns and the ZipTip to test for recovery.
C18 PhyTip® columns processing is compatible with many common mass spectrometry solvents
When desalting peptides for mass spectrometry analysis, the peptide must be eluted into a solution optimal for the type of downstream assay. For example, formic acid is preferred over TFA in the mobile phase when preparing a sample for ESI-MS to prevent interference with the electrospray.1 Both methanol and acetonitrile were tested with varying ion pairing agents against the C18 PhyTip columns. The use of 70% acetonitrile resulted in high yields with any of the pairing acids. The methanol concentration was required to be as high as 90% to achieve the same results. Figure 2. Elution solvent efficiency
Different combinations of solvents and acids were tested in recovering Cytochrome C from the 90 Å C18 PhyTip® column.
Discussion and conclusion
Mass spectrometry (MS) has become a powerful tool in separating and analyzing complex mixtures. In molecular biology, MS is useful for identifying and characterizing proteins through peptide mapping for use in biomarker discovery, antibody mapping, and other similar applications. Reverse-phase SPE of peptides or oligonucleotides before MS analysis has shown to increase the resolution of the results by decreasing the noise.2, 3
Biotage C18 PhyTip columns enable an automated clean-up process in order to streamline MS sample preparation. PhyTip columns perform the clean-up with the consistency, ease, and scalability that go hand-in-hand with automation. With the high capacity and versatility in protein binding, the C18 PhyTip column is the optimal choice in developing a fluid MALDI or LC-MS workflow.
References
- García MC; Hogenboom AC; Zappey H; Irth H. Effect of the mobile phase composition on the separation and detection of intact proteins by reverse-phase liquid chromatography- electrospray mass spectrometry. J Chromatogr A., May 2002, Vol. 957, No. 2, P187-199.
- Ragas JA; Simmons TA; Limbach PA. A comparative study on methods of optimal sample preparation for the analysis of oligonucleotides by matrix-assisted laser desorption/
ionization Mass Spectrometry Analyst 2000, Vol. 125, No. 4, P575-581 - Ronald E. Majors; Ashok Shukla. Micropipette Tip–Based Sample Preparation for Bioanalysis LCGC Europe, Dec. 2005, Vol. 18, No. 12
Literature number: AN969
