Introduction
Immunosuppressant drugs are instrumental in preventing organ and tissue rejection in patients undergoing transplant surgery. Mycophenolic Acid is a common immunosuppressant drug used in patient transplant therapy. The ability to monitor the trough levels in patients to evaluate dosing is important for the administration of the drug. The free drug and its glucuronidated metabolite can be found in patient serum. The ability to quantitate the amount of free drug and metabolite in patient serum is supported by using a fast and efficient supported liquid extraction sample preparation method using ISOLUTE® SLE+ plates. The free drug and metabolite can be recovered from serum using ISOLUTE SLE+ with high enough efficiency to allow for quantitation at target trough levels.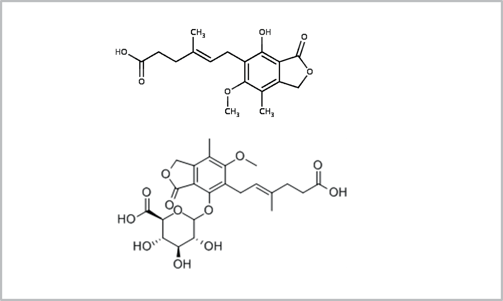
Figure 1. Structure of Mycophenolic Acid (MPA) and Mycophenolic Acid Glucuronide (MPAG)
Analytes
Mycophenolic Acid (MPA) and Mycophenolic Acid Glucuronide (MPAG)
Sample preparation procedure
Format: ISOLUTE SLE+ 200 μL Supported Liquid Extraction Plate, part number 820-0200-P01
Matrix: Pooled human serum
Sample Pre-treatment: Fortify 100 μL of negative serum with target analytes as needed to prepare target concentrations ranging from 0.1 µg/mL to 10 µg/mL (up to 10 μL of working standard). Add 90 μL of 20% aqueous formic acid to the samples then gently vortex the solutions.
NOTE: Total sample load volume should not exceed the recommended load capacity (200 µL) for each well. For larger sample volumes, the method can be scaled up for use with higher capacity ISOLUTE SLE+ plates or cartridges.
Sample Loading: Load pre-treated samples onto wells. Apply a short pulse of vacuum (VacMaster-96 Sample Processing Manifold) or positive pressure (PRESSURE+ 96 Positive Pressure Manifold) to initiate flow and then allow sample to absorb on cartridge for 5 minutes.
Analyte Elution: Apply ethyl acetate (2 x 500 μL) to each well and allow solvent to gravity flow. Apply positive pressure or pull slight vacuum as needed during collection process to facilitate a flow rate of 1 mL per minute.
Post Extraction: Evaporate sample and reconstitute in water:acetonitrile (50:50, v/v, 500 μL).
Additional Information: Working standards were prepared in 100% acetonitrile
HPLC conditions
Instrument: Agilent 1200 Liquid Handling System (Agilent Technologies, Berkshire, UK)
Cartridge: Restek Allure Organic Acids, 5µm analytical cartridge (150 x 4.6 mm id) (Restek, Bellefonte, PA).
Mobile Phase: A: 0.1% Formic Acid
B: Methanol containing 0.1% Formic Acid
Gradient:
|
Step |
Time (min) |
Flow Rate (µL/min) |
%A |
%B |
|
1 |
0.0 |
1000 |
90 |
10 |
|
2 |
0.30 |
1000 |
90 |
10 |
|
3 |
0.80 |
1000 |
2.0 |
98 |
|
4 |
1.5 |
1000 |
2.0 |
98 |
|
5 |
2.0 |
1000 |
90 |
10 |
|
6 |
5.0 |
1000 |
90 |
10 |
Mass spectrometry conditions
Applied Biosystems/MDS Sciex 4000 Q-Trap triple quadrupole mass spectrometer (Applied Biosystems, Foster City, CA.) equipped with a Turbo Ionspray® interface for mass analysis.
Ionization Source Temperature: 300 °C
|
Scan Function |
Analyte |
MRM Transition |
Declustering Potential (DP) |
Collision Energy (CE) |
Cell Exit Potential (CXP) |
|
|
1 |
MPA |
321.0 |
207.1 |
40 |
30 |
16 |
|
2 |
MPAG-1 |
321.1 |
207.1 |
40 |
30 |
16 |
|
3 |
MPAG-2 |
514.2 |
207.1 |
40 |
30 |
16 |
|
4 |
MPAG-3 |
497.1 |
207.1 |
40 |
30 |
16 |
Results
The MRM transitions were identified for the MPA and MPAG (see table 1). It became apparent immediately that the MPAG was fragmenting in the ionization source and losing the glucuronide moiety. The in-source fragmentation of MPAG to give mass transition MPAG-1 (MRM 321.1>207.1) yielded a significantly better response than the MPAG2 and MPAG-3 mass transitions. The MPAG-1 mass transition with in-source loss of glucuronide, makes the MPAG-1 transition a pseudo isobar of the parent compound (MPA). To address the isobar issue of using the same transition for MPA and MPAG, chromatographic separation was achieved at baseline resolution for the metabolite and free drug (Figure 2).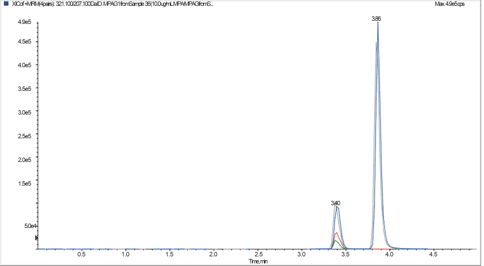
Figure 2. Extracted Ion chromatogram for 10 µg/mL MPA and MPAG extracted from serum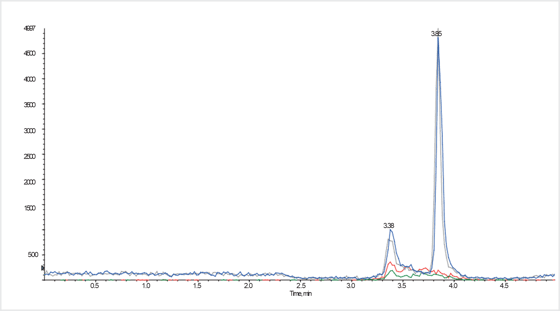
Figure 3. Extracted Ion chromatogram for 0.1 µg/mL MPA and MPAG extracted from serum
At concentrations >3 µg/mL any of the MPAG mass transitions can be used to qualitatively and quantitatively analyze the target analyte. At concentrations < 3 µg/mL the MPAG2 and MPAG3 mass transitions become less prevalent. Figure 3 shows a typical extracted ion chromatogram for the target analytes at LOD trough level of 0.1 µg/mL. The MPAG1 mass transition is the only transition with enough signal response to yield a peak.
The free drug and metabolite were fortified into serum across a dynamic range of trough levels to demonstrate the recovery of each analyte using supported liquid extraction. Figure 4 shows the averaged recoveries (n=7) for MPA and MPAG in serum from 0.1 µg/mL to 10 µg/mL. The %RSD for each concentration level was < 10%. The recoveries are sufficient to facilitate quantitation of each analyte across the concentration range.
 Figure 4. Plot of averaged recoveries across a concentration range for MPA and MPAG fortified and extracted from serum.
Ordering information
|
Part Number |
Description |
Quantity |
|
820-0200-P01 |
ISOLUTE® SLE+ 200 µL Supported Liquid Extraction Plate |
1 |
|
SD-9600-DHS-EU |
Biotage® SPE Dry Sample Concentrator System 220/240 V |
1 |
|
SD-9600-DHS-NA |
Biotage® SPE Dry Sample Concentrator System 100/120 V |
1 |
|
PPM-96 |
Biotage® Positive Pressure Manifold 96 position |
1 |
Literature number: AN810
