
Introduction
Mycotoxins are toxic metabolites produced by fungal molds on food crops. Regulation and legislation for testing of mycotoxin contamination have established which mycotoxins are prevalent on a wide variety of food crops. This application note describes a solid phase extraction (SPE) protocol appropriate for liquid chromatography tandem mass spectrometry LC-MS/MS analysis of a range of mycotoxins found on grain food crops.
The method described in this application note achieves high recoveries of all relevant mycotoxins from a range of different grain matrices with relative standard deviation (%RSD) and limit of quantitation (LOQ) that all meet the requirements set in european regulations for measurement of these analytes in grains.
ISOLUTE® Myco solid phase extraction columns provide robust, reliable sample preparation for multiple mycotoxin classes from a wide range of foodstuffs.
Using a single, easy to use sample preparation product, along with optimized matrix specific protocols, scientists can prepare diverse food/crop samples for analysis by LC-MS/MS.
Analytes
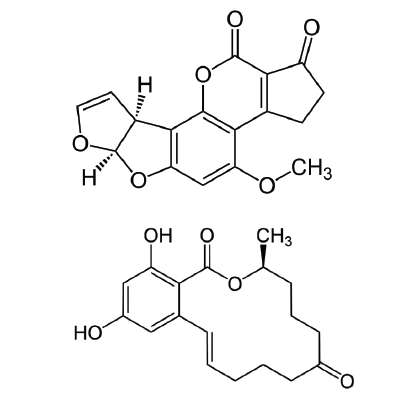
Figure 1. Structures of aflatoxin B1 and zearalenone
Analytes
Aflatoxin B1, aflatoxin B2, aflatoxin G1, aflatoxin G2, ergocryptine, ergocornine, ochratoxin A, fumonisin B1, zearalenone, T-2 mycotoxin, HT-2 mycotoxin
Sample preparation procedure
Column configuration
ISOLUTE® Myco 60 mg/3 mL column (Tabless) Part Number 150-0006-BG
Sample pre-treatment
- Sample processing: Grind the sample (wheat, maize, barley, 50 g). Store ground sample in a sealed container at room temperature until required.
- Extraction: Mix the ground whole grain (or flour) sample (5 g) with 50% acetonitrile (aq) (20 mL) and place on a shaking table for 30 minutes. Transfer the extract to a 50 mL centrifuge tube and centrifuge at 3000 g for 10 minutes.
- Dilution: Take the supernatant (8 mL), transfer to a new 50 mL centrifuge tube and dilute with water (32 mL). Centrifuge diluted extract at 3000 g for a further 10 minutes.
Condition
Condition the column with acetonitrile (2 mL)
Equilibration
Equilibrate column with water (2 mL)
Solid-phase extraction
Sample loading
Load pre-treated sample (3 mL) onto the column at a maximum flow rate of 1 mL/min (gravity load is recommended)
Interference wash 1
Wash the column with water (3 mL)
Interference wash 2
Wash the column with 10% acetonitrile (3 mL)
Drying
Dry the column for 5 minutes at 2 bar (29 psi) or maximum pressure
Elution 1
Elute with 0.1% formic acid in acetonitrile (2 mL)
Elution 2
Elute with methanol (2 mL)
Post elution
The combined eluate is dried in a stream of air or nitrogen using a TurboVap® LV (2.3 L/min at 35 °C). Reconstitute in 0.1 % acetic acid in 20% acetonitrile : methanol (1 mL, 1:1, v/v). Syringe-filter using a 0.2 µm PTFE membrane prior to analysis.
HPLC conditions
Instruments
Shimadzu Nexera UHPLC (Shimadzu Europe Gmbh)
Column
Kinetex XB-C18 50 x 2.1 mm 2.6 µm dp (Phenomenex, Macclesfield UK)
Mobile phase
A: mM ammonium acetate, 0.5% acetic acid
B: 1 mM ammonium acetate, 0.5% acetic acid in 95% methanol (aq) 0.45 mL/min
Flow rate: 0.45 mL/min
Injection
20 µL
Gradient
Initial 20 % B, hold 1.0 min
Iinear ramp to 73 % B in 6 min
linear ramp to 100 % B in 0.2 min, hold 2.3 min
linear ramp to initial conditions in 0.2 min
hold 2.3 min, total run time 10.0 min
Column temperature
40°C
Sample temperature
15°C
Table 1. Typical retention times for a range of mycotoxins using the LC-MS/MS method described
|
Retention Time (min) |
|
|
aflatoxin G2 |
3.3 |
|
aflatoxin G1 |
3.6 |
|
aflatoxin B2 |
3.9 |
|
aflatoxin B1 |
4.1 |
|
ergocornine |
4.0 |
|
ergocryptine |
4.5 |
|
fumonisin B1 |
5.4 |
|
HT-2 |
5.0 |
|
T-2 |
5.6 |
|
zearalenone |
5.9 |
|
ochratoxin A |
6.1 |
MS conditions
Ions were selected in order to achieve maximum sensitivity, and the MS was operated in dual polarity (+ve/-ve switching) mode, using multiple reaction monitoring.
Instrument
AB Sciex Triple Quad 5500 (Warrington, UK)
Source
Turbo-V ESI
Desolvation temp.
500°C
Curtain gas
30 psi
Spray voltage
+5.0 kV / -4.5 kV
Gas 1
60 psi
Gas 2
60 psi
Collision gas
7 psi
Table 2. Negative ion mode - MRM parameters
|
MRM transition |
|
RT |
Compound ID |
DP, V |
EP, V |
CE, V |
CXP, V |
|
720.2>157 |
4.2 |
fumonisin B1 1 |
-160 |
-12 |
-45 |
-15 |
|
|
720.2>562.3 |
4.2 |
fumonisin B1 2 |
-160 |
-12 |
-36 |
-15 |
|
|
317.2>131 |
|
4.7 |
zearalenone 1 |
-40 |
-4 |
-38 |
-15 |
|
317.2>175 |
|
4.7 |
zearalenone 2 |
-40 |
-4 |
-30 |
-15 |
|
317.2>255.1 |
|
4.7 |
zearalenone 3 |
-40 |
-4 |
-20 |
-15 |
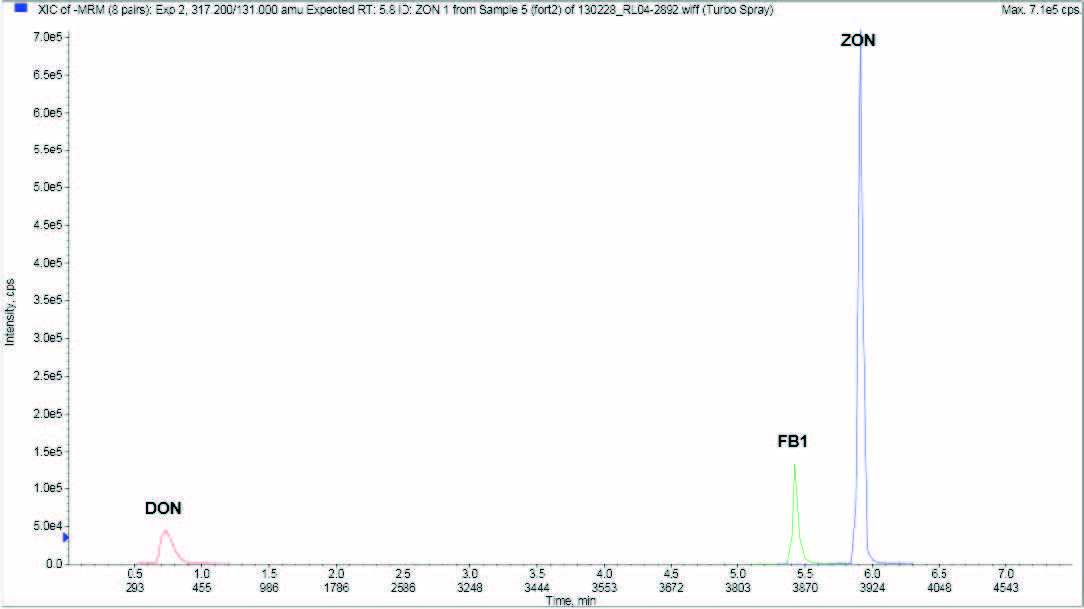 Figure 2. Extracted ion chromatograms in negative ion mode using ISOLUTE® Myco protocol at 50 µg/kg from wheat
Table 3. Positive ion mode - MRM parameters
|
MRM transition |
RT |
Compound ID |
DP, V |
EP, V |
CE, V |
CXP, V |
|
331.1>313.1 |
2.9 |
aflatoxin G2 1 |
100 |
10 |
41 |
12 |
|
331>245.1 |
2.9 |
aflatoxin G2 2 |
100 |
10 |
41 |
12 |
|
331.1>257.1 |
2.9 |
aflatoxin G2 3 |
100 |
10 |
41 |
12 |
|
329>243.1 |
3.1 |
aflatoxin G1 1 |
80 |
10 |
37 |
12 |
|
329>200 |
3.1 |
aflatoxin G1 2 |
80 |
10 |
53 |
12 |
|
315.1>287 |
3.3 |
aflatoxin B2 2 |
100 |
10 |
51 |
12 |
|
315.1>259.1 |
3.3 |
aflatoxin B2 2 |
100 |
10 |
40 |
12 |
|
315.1>243.1 |
3.3 |
aflatoxin B2 3 |
100 |
10 |
51 |
12 |
|
562.4>268.1 |
3.4 |
ergocornine 1 |
80 |
10 |
43 |
12 |
|
562.4>223.2 |
3.4 |
ergocornine 2 |
80 |
10 |
43 |
12 |
|
562.4>305.1 |
3.4 |
ergocornine 3 |
80 |
10 |
33 |
12 |
|
313.1>285 |
3.5 |
aflatoxin B1 1 |
100 |
10 |
31 |
18 |
|
313.1>241.1 |
3.5 |
aflatoxin B1 2 |
100 |
10 |
49 |
18 |
|
313.1>185 |
3.5 |
aflatoxin B1 3 |
100 |
10 |
65 |
18 |
|
576.3>223.1 |
3.7 |
ergocryptine 1 |
90 |
10 |
43 |
12 |
|
576.3>268.1 |
3.7 |
ergocryptine 2 |
90 |
10 |
33 |
12 |
|
576.3>305.1 |
3.7 |
ergocryptine 3 |
90 |
10 |
35 |
12 |
|
442.2>263.1 |
4.1 |
HT-2 toxin 1 |
50 |
12 |
18 |
12 |
|
442.2>215.1 |
4.1 |
HT-2 toxin 2 |
50 |
12 |
18 |
12 |
|
484.2>305.1 |
4.4 |
T-2 toxin 1 |
60 |
10 |
18 |
12 |
|
484.2>215.1 |
4.4 |
T-2 toxin 2 |
60 |
10 |
17 |
12 |
|
484.2>185.1 |
4.4 |
T-2 toxin 3 |
60 |
10 |
28 |
12 |
|
404.1>239 |
4.8 |
ochratoxin A 1 |
165 |
10 |
32 |
12 |
|
404.1>221 |
4.8 |
ochratoxin A 2 |
165 |
10 |
47 |
12 |
|
404.1>102 |
4.8 |
ochratoxin A 3 |
165 |
10 |
84 |
12 |
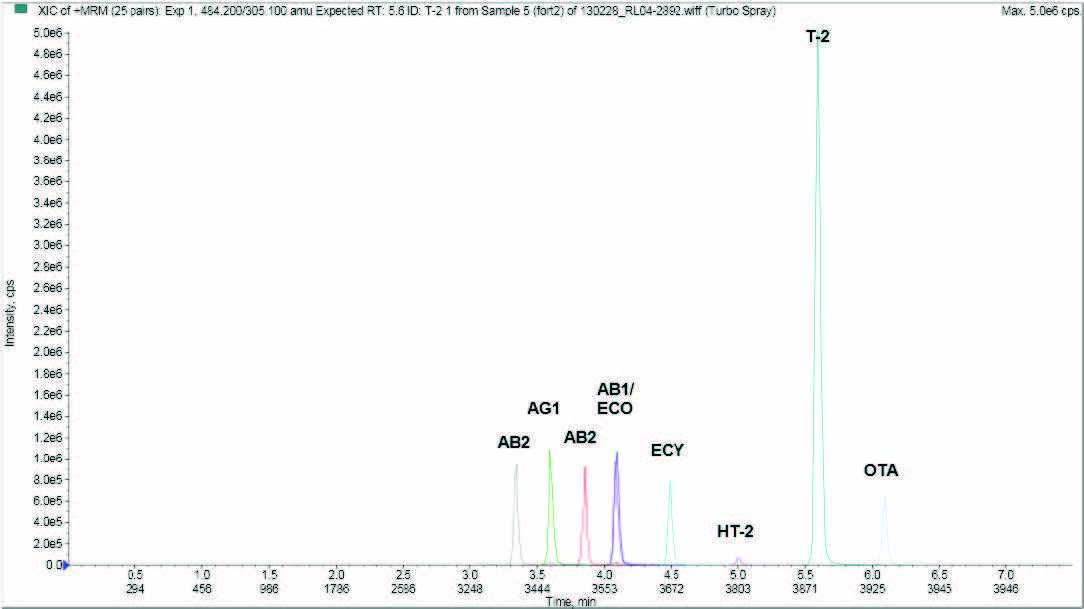 Figure 3. Extracted ion chromatograms in positive ion mode using ISOLUTE® Myco protocol at 5 µg/kg (aflatoxins and ochratoxin A) and 50 µg/kg (others) from wheat grain.
Validation criteria
Method linearity was determined using matrix-matched calibration standards in six replicates over a minimum of five levels (the majority were determined with seven levels); the ranges are shown below.
|
Analytes |
Working range, µg/kg (pg/µg on column) |
|
aflatoxin B1, aflatoxin B2, aflatoxin G1, aflatoxin G2, ochratoxin A |
0.67 to 66.7 (0.1 to 10) |
|
fumonisin B1, zearalenone, deoxynivalenol, ergocornine, ergocryptine |
13.3 to 1333 (2 to 200) |
|
T-2 toxin, HT-2 toxin |
13.3 to 800 (2 to 120) |
Limit of quantitation (LOQ) was determined from the lowest matrix-matched standard meeting EU repeatability and recovery criteria. Where no criteria were specified the LOQ criteria were estimated by correlation to similar analytes.
Repeatability (%RSDr) was determined from single acquisitions of five SPE replicates of a single sample extraction. The RSDs generated gave close agreement when a single sample was extracted and processed using ISOLUTE® Myco from three separate sorbent batches.
Recovery was determined as a % of ISOLUTE® Myco extract spike before sample prep to spike after at the EU minimum reporting limit (MRL).
Results
The extracted ion chromatograms in figures 2 and 3 demonstrate chromatography at 5 μg/kg (aflatoxins and ochratoxin A) and 50 μg/kg for all other analytes from a spiked extraction of 10 g ground wheat. Good linearity was achieved for all analytes in all the different matrices as demonstrated in the example charts shown in figures 4 and 5.
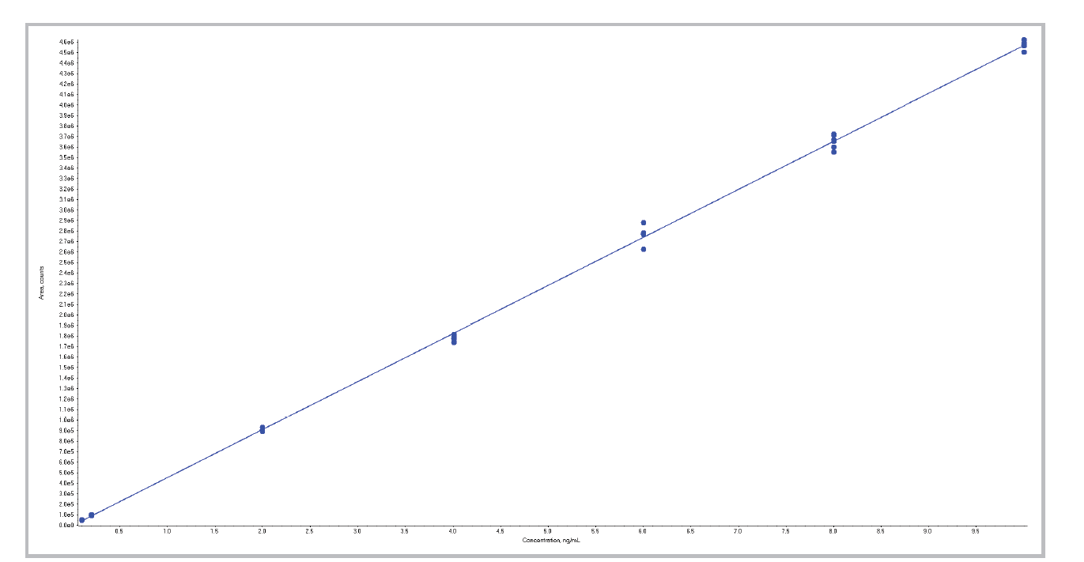
Figure 4. Calibration curve for aflatoxin B1 from ground wheat using the ISOLUTE® Myco protocol from 0.1 - 10 ng/mL.
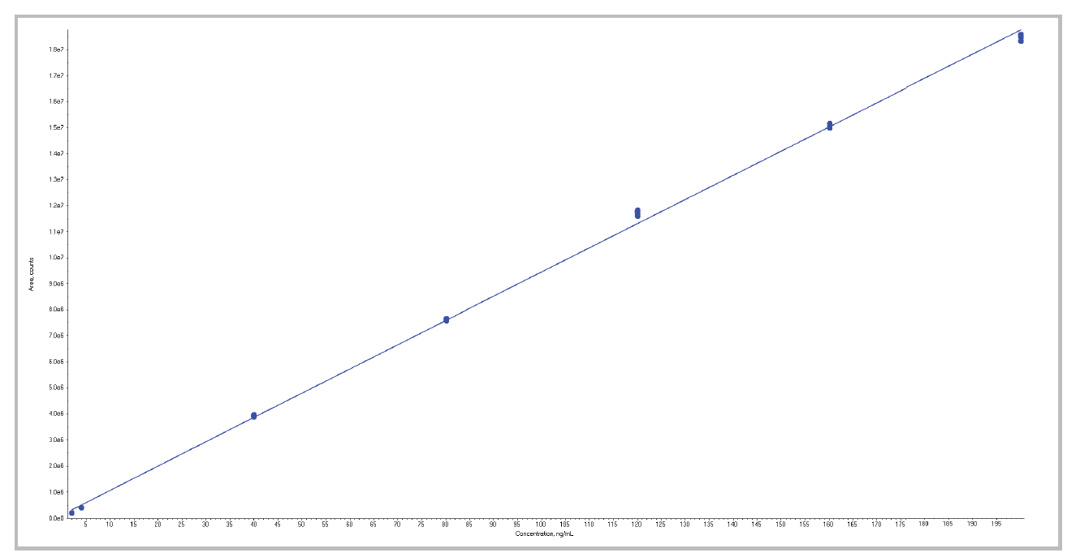
Figure 5. Calibration curve for T2 from ground wheat using the ISOLUTE® Myco protocol from 5 - 200 ng/ml.
All analytes extracted using the ISOLUTE® Myco protocol achieved the limits of quantities and recovery required by the current european standards for mycotoxin analysis as shown in tables 4, 5, and 6.
Table 4. Analyte recovery and limit of quantitation data for a range of mycotoxins from wheat using the ISOLUTE® Myco protocol.
|
Analyte |
r2 |
LOQ (µg/kg) |
%RSDr |
Recovery % |
|||
|
Wheat |
Target |
Actual |
Target |
Actual |
Target |
Actual |
|
|
aflatoxin B1 |
0.9994 |
2 |
0.67 |
40 |
3.0 |
50 to 120 |
96 |
|
aflatoxin B2 |
0.9990 |
2 |
0.67 |
40 |
3.7 |
50 to 120 |
99 |
|
aflatoxin G1 |
0.9990 |
2 |
0.67 |
40 |
3.7 |
50 to 120 |
99 |
|
aflatoxin G2 |
0.9998 |
2 |
1.33 |
40 |
3.3 |
70 to 110 |
110 |
|
ochratoxin A |
0.9995 |
3 |
1.33 |
40 |
5.9 |
70 to 110 |
88 |
|
T-2 toxin |
0.9996 |
50 |
13.3 |
40 |
3.8 |
60 to 130 |
102 |
|
HT-2 toxin |
0.9987 |
100 |
26.7 |
40 |
19.0 |
60 to 130 |
106 |
|
fumonisin B1 |
0.9997 |
1000 |
26.7 |
30 |
2.8 |
60 to 120 |
100 |
|
zearalenone |
0.9996 |
50 |
26.7 |
40 |
1.8 |
60-120 |
73 |
|
ergocornine |
0.9997 |
N/A |
13.3 |
N/A |
5.9 |
N/A |
96 |
|
ergocryptine |
0.9996 |
N/A |
13.3 |
N/A |
4.2 |
N/A |
76 |
Table 5. Analyte recovery and limit of quantitation data for a range of mycotoxins from maize using the ISOLUTE® Myco protocol.
|
Analyte |
r2 |
LOQ (µg/kg) |
%RSDr |
Recovery % |
|||
|
Maize |
Target |
Actual |
Target |
Actual |
Target |
Actual |
|
|
aflatoxin B1 |
0.9994 |
2 |
0.67 |
40 |
4.2 |
50 to 120 |
94 |
|
aflatoxin B2 |
0.9995 |
2 |
0.67 |
40 |
3.3 |
50 to 120 |
97 |
|
aflatoxin G1 |
0.9995 |
2 |
0.67 |
40 |
3.3 |
50 to 120 |
97 |
|
aflatoxin G2 |
0.9993 |
2 |
1.33 |
40 |
2.4 |
70 to 110 |
95 |
|
ochratoxin A |
0.9997 |
3 |
1.33 |
40 |
3.8 |
70 to 110 |
72 |
|
T-2 toxin |
0.9992 |
50 |
13.3 |
40 |
2.4 |
60 to 130 |
99 |
|
HT-2 toxin |
0.9989 |
100 |
13.3 |
40 |
4.5 |
60 to 130 |
97 |
|
fumonisin B1 |
0.9993 |
1000 |
26.7 |
30 |
2.6 |
60 to 120 |
100 |
|
zearalenone |
0.9995 |
50 |
26.7 |
40 |
2.8 |
60 to 120 |
71 |
|
ergocornine |
0.9995 |
N/A |
13.3 |
N/A |
2.0 |
N/A |
78 |
|
ergocryptine |
0.9995 |
N/A |
13.3 |
N/A |
1.1 |
N/A |
77 |
Table 6. Analyte recovery and limit of quantitation data for a range of mycotoxins from barley using the ISOLUTE® Myco protocol
|
Analyte |
r2 |
LOQ (µg/kg) |
%RSDr |
Recovery % |
|||
|
Barley |
Target |
Actual |
Target |
Actual |
Target |
Actual |
|
|
aflatoxin B1 |
0.9996 |
2 |
1.33 |
40 |
5.0 |
50 to 120 |
100 |
|
aflatoxin B2 |
0.9995 |
2 |
0.67 |
40 |
4.3 |
50 to 120 |
99 |
|
aflatoxin G1 |
0.9992 |
2 |
1.33 |
40 |
2.1 |
50 to 120 |
99 |
|
aflatoxin G2 |
0.9989 |
2 |
1.33 |
40 |
3.4 |
70 to 110 |
98 |
|
ochratoxin A |
0.990 |
3 |
2.00 |
40 |
4.5 |
70 to 110 |
96 |
|
T-2 toxin |
0.9981 |
50 |
13.3 |
40 |
8.5 |
60 to 130 |
96 |
|
HT-2 toxin |
0.9988 |
100 |
20.0 |
40 |
8.8 |
60 to 130 |
100 |
|
fumonisin B1 |
0.9995 |
1000 |
13.3 |
30 |
2.0 |
60 to 120 |
84 |
|
zearalenone |
0.9995 |
50 |
26.7 |
40 |
8.7 |
60 to 120 |
96 |
|
ergocarnine |
0.9996 |
N/A |
13.3 |
N/A |
2.2 |
N/A |
82 |
|
ergocryptine |
0.9997 |
N/A |
13.3 |
N/A |
2.5 |
N/A |
85 |
Literature number: AN782
