
Overview
This white paper evaluates Biotage reversed-phase solid-phase extraction (SPE)
sorbents for peptide desalting prior to LC-MS/MS analysis. Across recovery, reproducibility, retention, and sample cleanliness assessments, Biotage® Sfär Bio C18 showed the strongest overall performance, particularly for hydrophilic peptides and workflows requiring robust cleanup from complex biological matrices.
Abstract
Bottom-up approaches to protein analysis, quantification & characterization as used in protein sequencing, biotherapeutic peptide mapping, biomarker quantitation, and proteomics, often rely on aqueous buffer systems to maintain protein solubility and support proteolytic enzyme function. However, many buffers and reagents used in these workflows are incompatible with mass spectrometry. Samples derived from biological sources, such as plasma, tissue, or cell lysate, may also contain additional components that can interfere with mass spectrometry instrumentation.
Section 1: Comparison of Biotage RP-SPE sorbents for peptide desalting
Part 1: Introduction
Peptide desalting and sample clean-up are critical preparatory steps in mass spectrometry (MS)-based workflows such as proteomics, therapeutic bioanalysis, and peptide mapping applications, to name only a few. Following biological sample preparation and/or enzymatic digestion, analytes are often accompanied by salts, buffers, detergents, chaotropic agents, and other biological matrix components that can adversely affect chromatographic performance and suppress or enhance ionization during electrospray ionization (ESI)-MS analysis. These contaminants can reduce sensitivity, compromise quantitative accuracy, and result in drifting instrument performance, ultimately limiting the quality and reproducibility of analytical results. Effective peptide clean-up is therefore essential for maximizing peptide recovery while ensuring compatibility with downstream liquid chromatography-mass spectrometry (LC-MS) workflows.
Reversed-phase solid-phase extraction (RP-SPE) is the predominant approach for peptide desalting due to its ability to selectively retain peptides while removing highly polar impurities. By leveraging hydrophobic interactions between peptide analytes and the sorbent surface, RP-SPE enables efficient sample concentration, matrix removal, and transfer into MS-compatible solvents. The performance of the desalting step is directly influenced by sorbent characteristics such as surface chemistry, pore structure, particle morphology, and peptide retention mechanism, which collectively determine recovery, selectivity, and reproducibility across a broad range of peptide physicochemical properties. As analytical laboratories continue to demand higher sensitivity, greater throughput, and improved robustness, optimization of reverse-phase sorbent technology remains a key factor in achieving reliable and reproducible peptide-based analyses.
Biotage supplies a wide range of reversed-phase sorbents suitable for peptide desalting. This white paper presents a systematic comparison of Biotage reversed-phase sorbents, including particle size, pore size, and retention characteristics. Peptide recoveries and CVs are provided for peptides grouped by hydrophobicity, and an optimized desalting protocol is provided for peptide desalting prior to LC-MS/MS analysis using Biotage RP-SPE plates (Section 1). The paper also evaluates desalting efficiency and provides recommendations on wash aliquots and organic modifiers to help generate clean samples and high peptide recoveries prior to LC-MS/MS analysis (Section 2). Finally, the desalting protocol and best-performing SPE sorbent are applied in a proof-of-concept proteomics workflow for bottom-up digestion and analysis of pooled human plasma (Section 3).
Part II: Biotage® RP-SPE sorbents & SPE methodology
Six Biotage RP-SPE sorbents were selected for testing with peptides: Biotage® Sfär C18, Biotage® Sfär Bio C18 D, EVOLUTE® EXPRESS ABN, Evolute® EXPRESS ABN 120 Å, ISOLUTE® C18 (EC), and end-capped ISOLUTE® C18 (Table 1). Each plate was packed with a bed mass of 80 mg.
Table 1: Biotage RP sorbent characteristics
| Sorbent | Stationary phase | Pore size | Particle size |
| Biotage® Sfär C18 | C18 | 100 Å | 30 µm |
| Biotage® Sfär Bio C18 | C18 | 300 Å | 20 µm |
| EVOLUTE® EXPRESS ABN | P-DVB | 40 Å | 30 µm |
| EVOLUTE® EXPRESS ABN (120Å) | P-DVB | 120 Å | 30 µm |
| ISOLUTE® C18 | C18 | 60 Å | 50 µm |
| ISOLUTE® C18 (EC) | C18 | 60 Å | 50 µm |
All SPE experiments were processed on a Biotage® PRESSURE+ 96 positive pressure manifold. SPE protocols were held constant across sorbents to enable a direct comparison, and the general SPE protocol used is detailed in Table 2 below.
Table 2: General SPE protocol including pretreatment and post-elution steps
| RP-SPE 96-well plate (80 mg bed mass) peptide desalting procedure | |
| 1. Pretreat sample |
Dilute pooled peptides 1:1 (v/v) with 0.1% FA in H2O (final concentration roughly 0.5-3 µM / peptide).
Vortex briefly.
|
| 2. Condition | Condition with 2x 1 mL acetonitrile. |
| 3. Equilibration | Equilibrate with 2x 1 mL 0.1% FA in H2O. |
| 4. Load |
Load 1 mL diluted peptides onto SPE bed.
Apply positive pressure (0.5-1.5 psi, >60 s) to slowly push peptides onto sorbent.
|
| 5. Wash 1 | Add 1 mL 0.1% FA in H2O to SPE plate. Apply positive pressure (0.5-1.5 psi, >60 s) to slowly elute polar interferences. |
| 6. Wash 2 |
Add 1 mL 0.1% FA in H2O to SPE plate.
Note that for recovery and CV experiments, wash 2 was omitted. At this stage, 5-50% ACN was added during some experiments to test peptide retention in the presence of organic modifier. Additionally, experiments with higher aqueous wash aliquot numbers were performed to test peptide retention versus volume of aqueous wash. Apply positive pressure (0.5-1.5 psi, >60 s) to slowly elute polar interferences.
On the last wash step, increase pressure slowly to completely remove AQ solvent prior to elution step. |
| 7. Elute |
Elute peptides with 2x 500 µL 80:20:0.1 ACN:H2O:FA
Apply positive pressure (3psi) to elute peptides.
After 2nd elution, increase positive pressure to 4-5 psi to push remaining solvent off SPE bed.
|
| 8. Post-Elution |
Dry under N2 at 30 L/min flow, 50°C gas, 50°C plate using the TurboVap® 96 Dual. Ramp plate height 65–80 mm.
Reconstitute with 500 µL 5:95:0.1 ACN:H2O:FA.
Cover and vortex plate at ~2200 rpm for 3-5 minutes.
|
Part III: Properties of peptide analytes
To provide a suitable pool of peptides spanning in the range of sequence length, hydrophobicity, and sequence composition typical of proteolytic digestion across a wide range of proteins, four common proteins (BSA, chicken egg ovalbumin, equine myoglobin, and equine cytochrome C) were digested with trypsin. The digestion conditions were as follows: 1-10 mg protein was dissolved in 900 µL 6 M urea, 50 mM Tris-HCl, pH 8. Then, 100 µL 100 mM dithiothreitol (DTT) was added, and the sample was incubated at 37°C for 1 h to denature the protein and reduce disulfide bonds. Following this, 100 µL of 300 mM iodoacetamide (IAA) was added, and the sample was allowed to sit at room temperature in the dark for 30 minutes to alkylate free cysteines. Afterward, samples were diluted with 50 mM Tris, pH 7.6, to reduce the urea concentration to approximately 1 M. Trypsin (Sigma) was added to each sample at a 1:50 (w/w) ratio. Following brief and gentle vortexing, samples were incubated overnight at 37°C to complete trypsin digestion of the proteins. Upon completion of the digestion, samples were acidified with 0.5% formic acid (by volume) to inactivate trypsin. The raw protein digests were subjected to a mild desalting protocol designed to minimize sequence loss while also providing a pooled peptide sample clean enough for pre- and post-SPE spiking studies to obtain recovery data. Briefly, this desalting protocol used Biotage® Sfär C18 to desalt 500 µL of peptides with 2 x 500 µL 0.1% FA in H2O (aqueous wash), followed by 2 x 250 µL 80% ACN and 2 x 250 µL 95% ACN to elute peptides. Initial experiments showed that 80% ACN was better than 95% ACN for fully eluting peptides and maintaining solubility, and 80% ACN was used thereafter in 2 x 500 µL aliquots to fully elute peptides. Peptides were dried using the TurboVap® 96 Dual and reconstituted in 5% ACN, 0.1% FA in H2O for use in pre- and post-SPE spiking studies to obtain peptide recovery, retention, and CV data. More than 90 peptides were identified from the protein digestions using untargeted LC-MS/MS analysis on a Sciex 4000 QTRAP, and a targeted LC-MRM method was built from the untargeted results for later peptide desalting experiments (see Part IV: LC-MS/MS Methodology and Data Analysis and Table S1 for peptide sequences and properties).
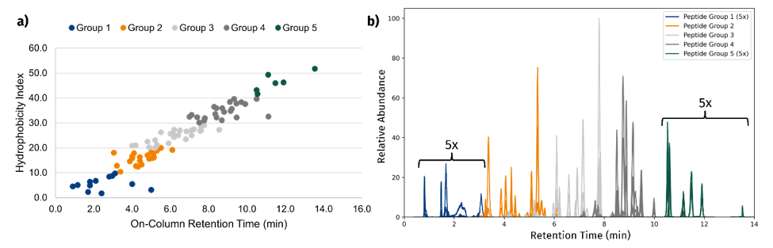
Figure 1: Grouping of peptides by hydrophobicity. a) Plot of peptide on-column retention vs hydrophobicity index indicating a linear relationship. Peptides are grouped by hydrophobicity index (group 1, H1 <10; group 2, 20 > H1 ≥ 10; group 3, 30 > HI ≥ 20; group 4, 40 > HI ≥ 30; group 5, HI ≥ 40). b) Peptide groups indicated on the LC-MS/MS chromatogram. Groups 1 and 5 are zoomed 5x for visibility.
Part IV: LC-MS/MS methodology and data analysis
For both untargeted qualitative characterization of the tryptic protein digestions and semi-quantitative interrogation of Biotage RP-SPE sorbents, a Sciex 4000 QTRAP and Shimadzu Nexera X2 UHPLC were used. For untargeted analysis of protein digestions, the QTRAP was operated in data-dependent acquisition mode (EMS-IDA-EPI). A targeted LC-MRM method was built from the untargeted analysis using the 2-4 best transitions per peptide to enable relative quantitative comparison of peptide recoveries, CVs, and retention across sorbents.
For the targeted analysis of pooled human plasma, a Sciex 5500 and Exion LC UHPLC were used for increased sensitivity. The Sciex 5500 was operated in scheduled and unscheduled MRM mode. See section 3 part II for information on the targeted method refinement.
All data analysis and visualization were performed using a combination of Skyline (University of Washington, v25.1.0.142)1, Microsoft Excel, and Python scripts. Peptide hydrophobicity indices and other physical properties were calculated using the Thermo Peptide Synthesis and Proteotypic Peptide Analyzing Tool.2
Table 3: LC-MS/MS parameters
| Parameter | Sciex 4000 Qtrap | Sciex 5500 QQQ |
| Ionspray (IS) | +2500.0 V | +2500.0 V |
| GS1/GS2 | 60.0/60.0 | 60.0/60.0 |
| Source Temp | 400.0°C | 400.0°C |
| Curtain Gas | 20.0 | 20.0 |
| Collision Gas | High | 7.0 |
| UHPLC | Shimadzu Nexera X2 | ExionLC |
| Column | Restek Raptor ARC-18 150 x 2.1 mm, 5 µm | Same Column |
| Precolumn | Restek Raptor ARC-18 5 x 2.1mm, 5 µm | Same Precolumn |
| Flow Rate | 0.4 mL/min | 0.4 mL/min |
| Column Temp | 35°C | 35°C |
| Autosampler Temp | 8°C | 8°C |
| Scan Modes | MRM, EMS-IDA-EPI | MRM |
| Scan Modes | MRM, EMS-IDA-EPI | MRM |
| MPA/MPB | 0.1% FA in H2O / MeCN | Same MPA/MPB |
| Gradient | 5-38% B in 11.5 min | 5-40% B in 25 min |
| Injection Vol. | 5 µL (pooled peptides) | 10 µL (plasma digests) |
Part V: Results and discussions of peptide recoveries and CVs by sorbent and peptide group
To assess peptide recoveries across the six Biotage RP-SPE sorbents selected for testing, 500 µL of pooled peptide mixture was subjected to the RP-SPE desalting protocol. Identical SPE protocols were conducted across all six sorbents to enable a one-to-one comparison of peptide recoveries (see table 2). The initial pooled peptide mixture was used as the reconstitution solvent following dry down of blank elution solvent (80:20:0.1 ACN:H2O:FA) to create the post-spike sample. Recovery was calculated on a per-peptide basis as the average peak areas of n=3 pre-spikes divided by the average peak areas of n=3 post-spikes x 100 (figure 2). For each peptide, %CV was calculated from the mean and standard deviation of the n=3 pre-spike peak areas (Figure 3).
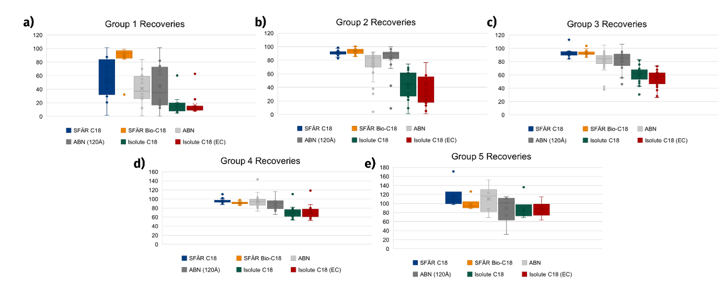
Figure 2: Peptide recoveries by hydrophobicity group and sorbent. Individual points represent recovery values calculated for a specific peptide sequence based on n=3 replicates in a pre-spike prior to SPE compared to a post-spike sample via peak areas.
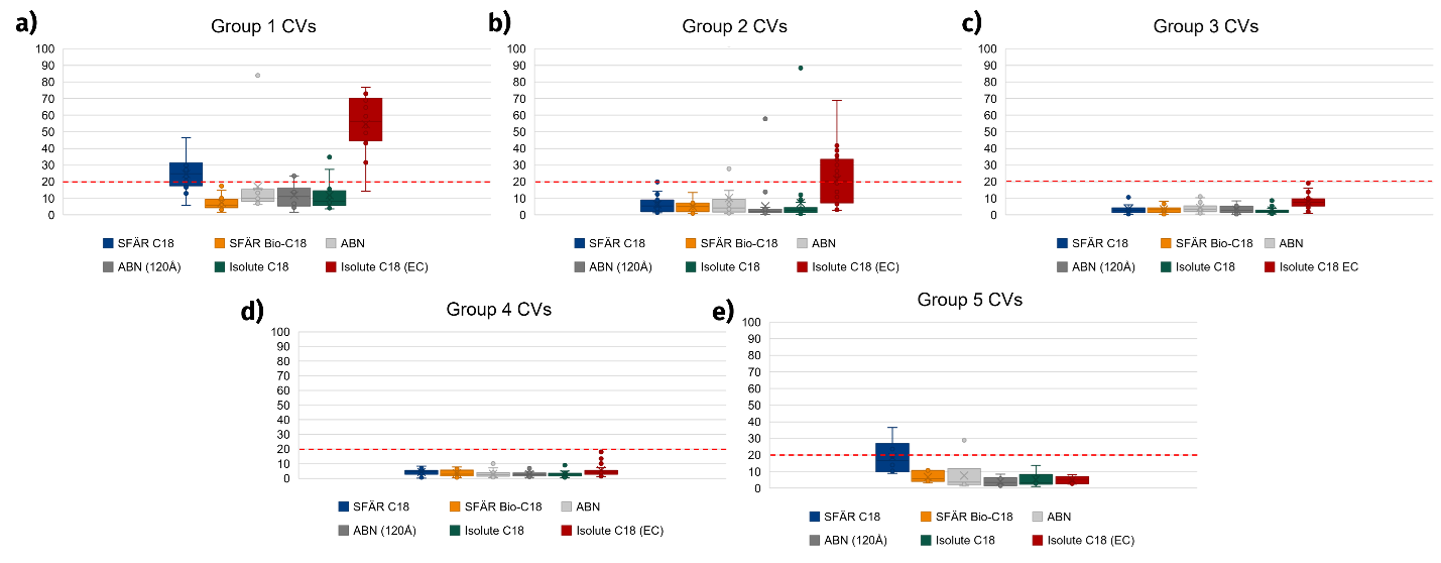 Figure 3: Peptide CVs by hydrophobicity group and sorbent. Individual points represent CV values calculated for a specific peptide sequence based on n=3 replicates in a pre-spike prior to SPE.
While CVs across peptide groups and sorbents were generally similar (figure 3), comparison of peptide recoveries across RP-SPE sorbents yields insightful results (figure 2). Peptide recoveries across the sorbents tested generally followed the trend of Biotage® Sfär Bio-C18 > Biotage® Sfär C18 > EVOLUTE® ABN = EVOLUTE® ABN 120 Å > ISOLUTE® C18 = ISOLUTE® C18 EC. While the differences between Biotage® Sfär Bio-C18 and Biotage® Sfär C18 are not as noticeable for peptide groups 2-4, for the most hydrophilic peptides in group 1 these differences are extremely noticeable. While group 1 peptide recoveries for Biotage® Sfär range from 20-85%, group 1 peptide recoveries are noticeably higher for Biotage® Sfär Bio-C18, with all but one sequence being recoverable more than 80% (see Figure 2a). The most likely explanation for this large difference between Biotage® Sfär Bio-C18 and Biotage® Sfär C18 is the large pore size differences (100 Å and 300 Å, respectively). Larger pore sizes create a larger surface area over which analytes can experience reversed-phase retention, and if the pores are large enough, then smaller analytes can even partially or fully enter pores. In the case of the small and hydrophilic peptides in group 1, these larger pores provide much higher retention than smaller-pore C18. This trend is further supported by the markedly lower recoveries observed for ISOLUTE® C18, which has an even smaller pore size of 60 Å.
On the other hand, EVOLUTE® ABN performed significantly better in terms of peptide recovery than ISOLUTE® C18 did but did not perform quite as well as Biotage® Sfär C18 / Bio-C18. There are a few characteristics that might explain these observations. When comparing EVOLUTE® EXPRESS ABN to Biotage® Sfär C18 / Bio-C18, the polymeric stationary phase could be less retentive of peptides overall than C18. In general, when it comes to hydrophobic interactions, it can be assumed that the stationary phase will interact more with compounds that are similar in structure. The backbone of a peptide is structurally much more similar to C18 than to the conjugated ring structure of the EVOLUTE® EXPRESS ABN polystyrene-divinylbenzene (Figure 4). Thus, it could be that peptides will be better retained on C18 than on ABN due to the structural differences between these stationary phases.
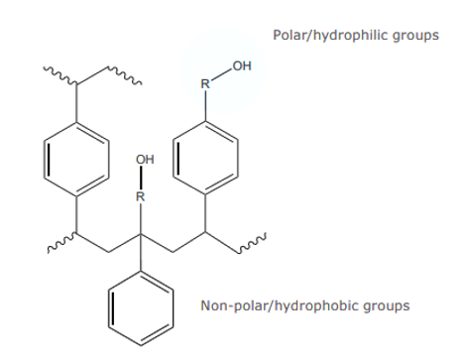 Figure 4: EVOLUTE® ABN stationary phase structure
However, this does not explain why EVOLUTE® EXPRESS ABN outperformed ISOLUTE® C18 in peptide recovery. The most likely explanation for this observation is the difference in particle sizes between EVOLUTE® EXPRESS ABN and ISOLUTE® C18 (30 µm and 50 µm, respectively). Larger particles result in fewer overall particles getting packed into the same volume versus smaller particles. In the case of smaller particles, it is possible that the fixed packing volume within a 96-well plate or cartridge is used more efficiently and results in a greater available surface area of reverse-phase interactions, thus explaining the differences between ABN and ISOLUTE® C18 retention.
Part VI: Organic modifier and aqueous wash volume results on peptide retention
In the case of samples with matrix components beyond polar salts, it can be necessary to adjust wash strength to remove additional contaminants. Considering this, a modified SPE protocol was tested for Biotage® Sfär C18, Biotage® Sfär Bio C18, EVOLUTE® EXPRESS ABN, and EVOLUTE® EXPRESS ABN 120 Å in which wash 2 was modified with 5-50% ACN to test peptide retention in the presence of elevated organic percentage. Wash 1 composition and volume was held constant at 1 mL 0.1% FA in H2O, and the resultant peptide areas were normalized to the peptide areas obtained for an initial “gentle” washing protocol, which involved reduced volume (500 µL) and no organic modifier for wash 1 & 2. The results are shown in Figure 5.
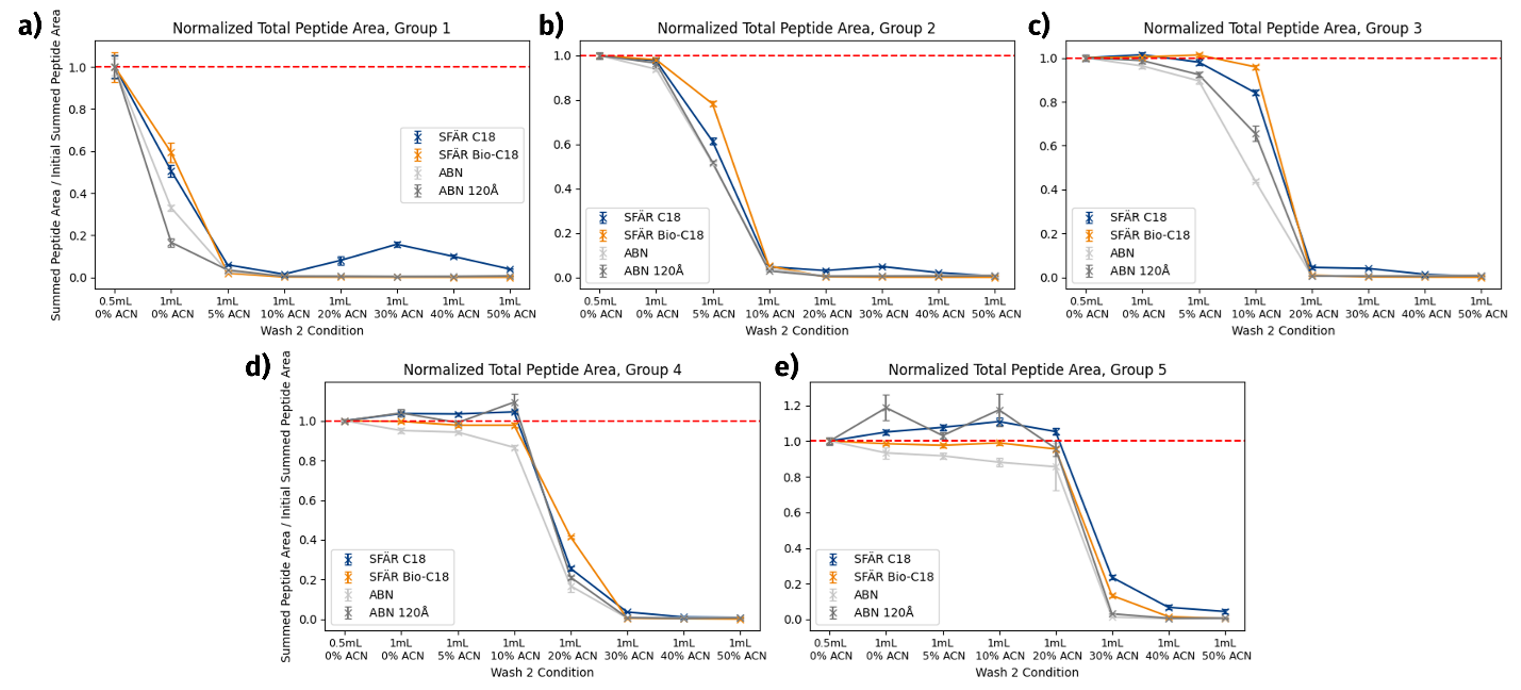 Figure 5: Aqueous volume and organic percentage effects on peptide retention by sorbent and peptide group. Individual points represent sum of all peptide areas from the specified peptide group at the specific wash condition divided by the sum of peptide areas at the initial wash condition (2x 0.5 mL 0.1% FA H2O). Error bars represent the standard deviation of n=3 replicates.
In figure 5 (a-e), relatively predictable results can be observed as peptide hydrophobicity increases from the most hydrophilic peptides in group 1 to the most hydrophobic peptides in group 5. Peptides from group 1 were very sensitive to aqueous wash volume, with a 40-80% decrease in peptide areas observed from the initial 2x 500 µL aqueous wash to the 2x 1 mL aqueous wash condition. 5% ACN addition in wash 2 resulted in nearly 100% loss of peptides from this group. Notably, Biotage® Sfär Bio C18 retained peptides better than the other 3 sorbents at the increased aqueous wash volumes, exhibiting only a 40% reduction in peptide peak areas versus higher losses observed for Biotage® Sfär C18, EVOLUTE® EXPRSS ABN, and EVOLUTE® EXPRESS ABN 120 Å (~50%, ~60%, and ~80%, respectively). In contrast, peptide group 2 (consisting of peptides less hydrophilic than group 1) exhibited no significant loss of peptides upon increased aqueous wash volume (Figure 5b). In fact, peptides from groups 2-5 exhibited very little losses when much larger numbers of aqueous wash aliquots were tested with Biotage® Sfär Bio C18, indicating that it is possible to wash peptides quite thoroughly with aqueous washes if necessary (figure 6).
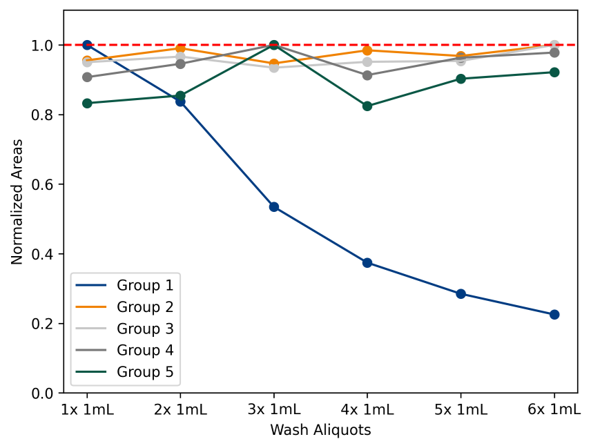 Figure 6: Result of repeated aqueous wash aliquots (1 mL 0.1% FA in H2O per aliquot) on peptide retention with Biotage® Sfär Bio C18. All peptides are well-retained on this sorbent even at elevated wash volume, except for the most hydrophilic peptides in group 1.
However, organic modifier is more of a concern for peptide retention. While group 2 peptides were still observable with an increased organic content in wash 2 up to 5% ACN, these peptides were not retained well at this condition and resulted in a 20-50% decrease in peptide peak areas depending on the sorbent tested (Figure 5b). Biotage® Sfär Bio C18 still retained peptides best over the other tested sorbents, exhibiting only a 20% loss in peptide areas at the 5% ACN wash condition. As could be expected, peptide groups 3-5 tolerated increased ACN content of 5, 10 and 20% respectively with minimal losses. Overall, peptide groups 1-3 also demonstrated increased retention on SFÄR Bio C18 relative to Biotage® Sfär C18 and ABN sorbents even in the presence of elevated organic content / increased aqueous wash volume. This is likely due to the previously mentioned pore size and retention mechanism differences. Additionally, elevated peptide areas greater than the obtained values for the initial wash conditions were observed in some cases for peptides group 4 & 5. This is likely due to the more hydrophobic nature of these peptides, as some peptides may not have been fully eluted from the stationary phase at the initial wash condition (2x 500 µL 0.1% FA in H2O).
Section 2: Assessment of desalting efficiency and sample cleanliness
Part 1: Conductivity measurements to assess extract salinity
The removal of buffer salts and other polar matrix components potentially harmful to mass spectrometry is perhaps the most important purpose of peptide desalting in bioanalytical & proteomics workflows. Assessing cleanliness of extracts can be difficult from LC-MS data alone. For the purpose of assessing the cleanliness of the extracts post-RP SPE desalting, a handheld conductivity probe was used to measure the conductivity of solutions at various steps of the desalting process. In such an experiment, cleaner aqueous extracts should give very low conductivity readings, and aqueous extracts with higher salinity should give higher conductivity readings. For these tests, a modified SPE protocol was utilized (see Table 4).
Table 4: SPE protocol for buffer elution tests
| Step | Solvent |
| Conditioning | 2x 1 mL ACN |
| Equilibration | 2x 1 mL H2O |
| Loading | 1 mL 25mM Tris-HCl |
| Wash 1 | 1 mL H2O |
| Wash 2 | 1 mL H2O |
| Elution | 2x 500 µL 80% ACN |
To relate conductivity readings (µS/cm) to buffer concentration, a calibration curve was constructed via serial dilutions from 25 mM Tris-HCl down to 0.4 mM Tris-HCl and the device response was found to be linear over this range (figure 5a). During SPE, conductivity measurements were taken of the initial 25 mM Tris-HCl sample, flow-through from the loading step, and wash 1 and wash 2 steps. Following elution, eluent was dried down according to the TurboVap® 96 Dual procedure detailed in table 2 and extracts were reconstituted in H2O prior to taking conductivity measurements of the eluent. The results are shown in figure 7 for Biotage® Sfär Bio C18, which show that > 80% of the buffer content is washed out during the loading step, and the remaining salts are removed during the first wash step. Similar results were observed for the other reverse-phase sorbents tested (data not shown). While these results would indicate that only a single aqueous wash is necessary for full peptide desalting, it is recommended that a more robust wash protocol with 1-2 aqueous washes is followed in the case of samples with much greater initial salinity or with samples originating from biological matrices.
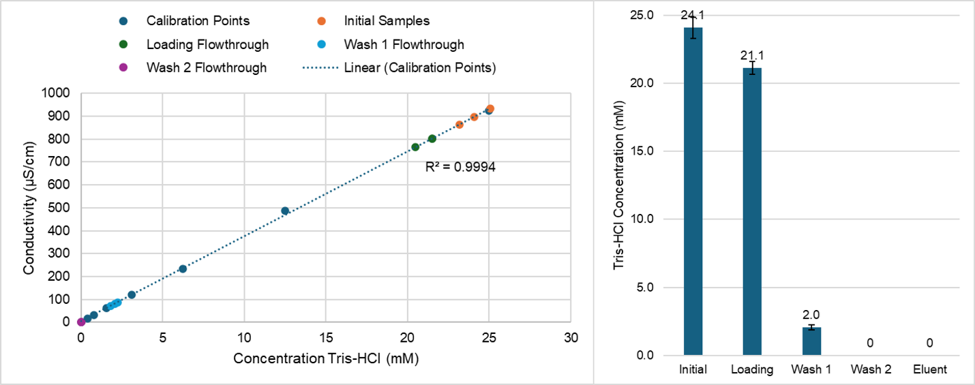 Figure 7: Conductivity calibration curve (a) and conductivity readings for Biotage® Sfär Bio C18 at the various steps of the desalting process (b)
Part II: Utilization of filter+ plates for a final cleanup step prior to injection
Though RP-SPE should trap any leftover particulates from the initial samples during the desalting process, a final filtration step prior to injection on the LC-MS/MS system may still be necessary in some cases to avoid increased backpressure over time. Biotage® FILTER+ plates are an effective way to process final sample extracts in a 96-well format to remove particulate matter. No significant loss of peptides was observed when using the 0.2 µm FILTER+ plates for final sample cleanup prior to LC-MS injection and analysis.
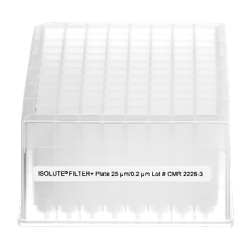 Figure 8: Biotage filter plate
Part III: General recommendations for peptide desalting protocol design with Biotage RP-SPE sorbents
From the above results, there are a few considerations to keep in mind when designing a peptide desalting protocol. First, the amount of sample to be loaded on the stationary phase must be considered. This will be affected not only by the starting concentration of peptides, but also by the amount of matrix components present which may compete for binding locations on the stationary phase. In general, the binding capacity of a non-polar SPE sorbent can be assumed to be 1-5% of the sorbent bed mass. Aiming beneath this number will provide a safety net should the sample be particularly dirty, more concentrated than expected, or contain a significant amount of competitive binding components.
Second, the expected peptide hydrophobicities (or lack thereof) must be considered. In the case of a very targeted experiment with a small number of peptides with similar characteristics, it may be possible to tailor an SPE protocol to capture just these peptides while removing much of the competing peptides and matrix components. On the other hand, in the case of a more untargeted experiment seeking to profile as many peptides as possible (such as with proteomics or peptide mapping experiments), a less selective desalting protocol must be adopted to avoid losing peptides prior to LC-MS analysis.
Based on these considerations, an SPE protocol with a minimum of a single aqueous wash prior to organic elution is recommended as a starting point. For samples with higher initial salinity or originating from biological matrices, 2nd and 3rd aqueous wash steps can be added to further reduce the salt content prior to elution. When working with samples containing potentially hydrophilic peptides, omission of any percentage of organic is recommended. If working with more hydrophobic peptides with a strongly retentive sorbent such as Biotage® Sfär Bio C18, an initial aqueous wash can be performed first, followed by a second wash with 5-10% organic to remove any potential nonpolar interferences or matrix components. Organic content > 10% is not recommended due to excessive loss of peptides unless it is known that the peptides in question are able to be retained on the sorbent at a higher percentage of organic.
Section 3: Proof-of-concept Sfär Bio C18 demonstration with pooled human plasma
Part I: Sample preparation
As a proof-of-concept to demonstrate Biotage® Sfär Bio C18 utility as a peptide cleanup tool when working with a direct digestion of potential endogenous protein biomarkers in a biological matrix, human plasma was subjected to an in-solution trypsin digestion followed by RP-SPE cleanup. Briefly, 10 µL of pooled K2EDTA human plasma was aliquoted into 1.5 mL vials for each replicate. Plasma proteins were denatured and disulfides reduced via addition of 90 µL 6 M guanidinium chloride (Gdn-Cl) and 10 mM TCEP in 200 mM NH4HCO3 pH 8. Samples were incubated for 30 minutes at 40°C. To cap reduced disulfides, 10 µL of 330 mM iodoacetamide (IAA) dissolved in water was added and allowed to react for 30 minutes in the absence of light. To consume any excess IAA, 10 µL dithiothreitol (DTT) dissolved in water was added, and samples were allowed to sit at room temperature for 10 minutes. To reduce the Gdn-Cl concentration prior to addition of trypsin, 870 µL 50 mM NH4HCO3 pH 8 was added. Trypsin was then added at a weight ratio of 1:50 or 1:20. Following brief mixing, digestion was allowed to proceed at 37°C for 2, 3.5 and 19 h (overnight). Digestions were quenched via addition of formic acid to a volume of 1% to inactivate trypsin. Samples not immediately desalted for analysis were stored at -80°C.
Following digestion, samples were desalted using Biotage® Sfär Bio C18 via the protocol in table 2 with the following exceptions: No pretreatment/dilution of samples was performed. Following conditioning, equilibration, and loading, two aqueous washes were performed with 1 mL 0.1% FA in H2O, reconstitution was 200 µL 5:95:0.1 ACN:H2O:FA. Following a brief vortex to solubilize peptides, samples were run on a Sciex 5500 QqQ and Exion LC using a targeted LC-MRM method developed to monitor resultant peptides from major plasma proteins. 10 µL of peptides were injected on-column.
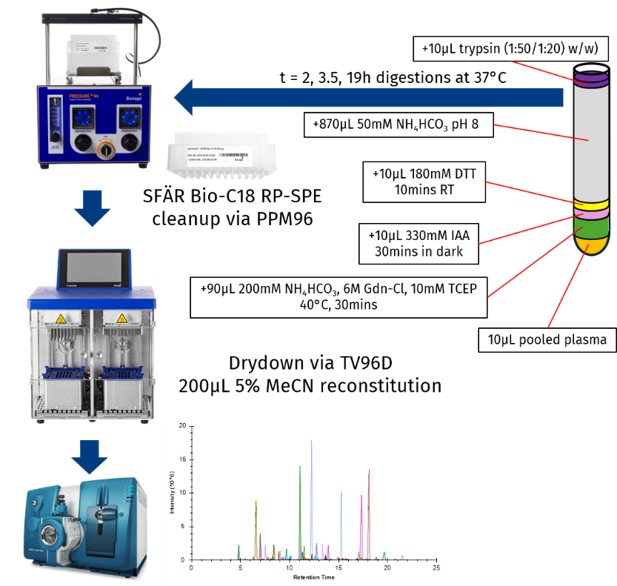 Figure 9: Pooled human plasma sample preparation including in-solution protein digestion, Biotage® Sfär Bio C18 SPE cleanup and TurboVap® 96 Dual dry down prior to reconstitution and LC-MS analysis of resultant peptides.
Part II: Plasma protein target refinement & LC-MS/MS method development
In order to create a targeted LC-MS method for analysis of digested plasma proteins, a series of online, publicly available databases were utilized, followed by LC-MS screening to determine which proteins were empirically observable (Figure 10). Briefly, the Human Plasma PeptideAtlas3 was used to obtain an initial list of relevant plasma proteins.4 This list of proteins was then filtered via UniProt5 to exclude proteins not annotated for disease associations. Then, the resultant list of proteins was uploaded to SRMAtlas6 and the top 6 empirically observable peptides from each protein were exported. This list was imported into Skyline1 and matched to a NIST HCD spectral library.7 Any peptides lacking a match to the spectral library were discarded. Using Skyline, 27 separate unscheduled LC-MRM methods were created spanning each of the peptides in the document, and 27 separate injections were performed on a pooled digestion to determine which peptides were observable in these experiments.
Following the 27 injections, the data was imported into Skyline and further refined. Peptides with library dot product (dotp) scores of < 0.7 were removed from the document. Additionally, any peptides with ambiguous or noisy extracted chromatograms or signs of interference were removed from the document. Following this, any empty proteins or proteins with fewer than 2 peptides were removed from the document. The resultant peptides were exported from Skyline into a single scheduled LC-MRM method, and this method was run on the digestion replicates. Following re-import of the data, peptides were refined a final time, excluding peptides for which replicates did not have a dotp score of 0.8 or higher figure 11c). The final resultant targeted method contains 147 peptides spanning 52 high-abundant plasma proteins (example proteins in figure 11a). The overall protocol and LC-MS method was found to provide suitably low CVs < 10% and reproducible peptide peak areas for the complement system proteins when performing a trypsin digestion at 1:50 w/w for 19 h or 1:20 w/w for 3.5 h (see figure S1). While further LC-MS method validation with synthetic sequences, SIL peptides, and/or high-resolution mass spectrometry would be ideal before moving to a production-ready environment, this method was deemed suitable as a proof-of-concept for demonstration of the utility of Biotage® Sfär Bio C18 for peptide cleanup from a biological matrix following protein digestion. This digestion and SPE protocol could easily be adapted to a range of biomarker or proteomics applications.
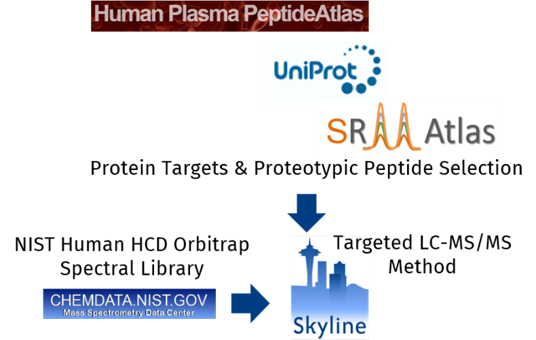 Figure 10: Targeted LC-MS method construction
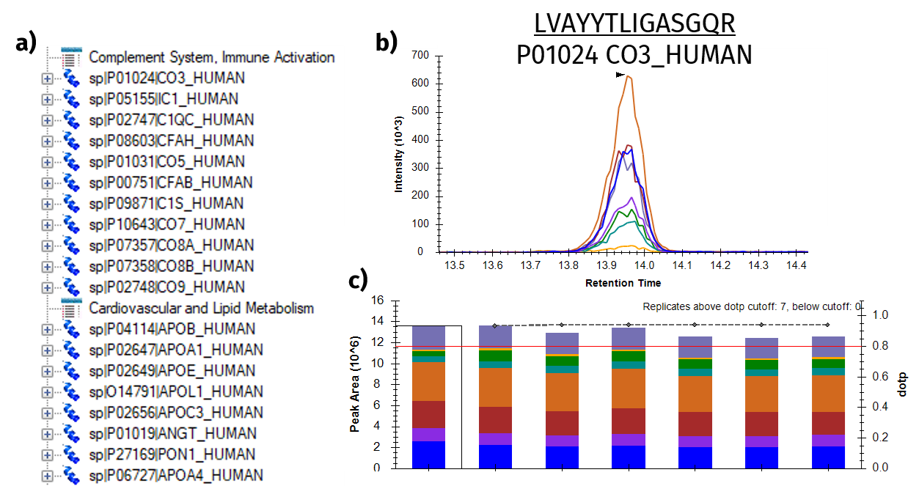 Figure 11: Targeted LC-MS method refinement. a) Example high abundance complement system and cardiovascular proteins identified with ≥ 2 peptides per protein. b) Example chromatogram for the peptide LVAYYTLIGASGQR from P01024 CO3_HUMAN. c) Monitored fragment ion areas for peptide LVAYYTLIGASGQR and spectral library dot product (dotp) scores for 6 replicate digestions. Peptides with dotp scores of less than 0.8 were removed from the document.
Part III: Sample cleanliness and qualitative phospholipid monitoring
When working with a biological matrix, it is important to consider the cleanliness of the final obtained extracts. Simply assuming cleanliness can be disastrous, particularly when the mass spectrometry system in use is operated in a targeted manner rather than in full-scan mode, where the LC-MS/MS data itself may not contain information that is readily available to determine the overall sample cleanliness.
To determine the cleanliness of the digested and RP-SPE cleaned peptides from Part II above, peptide chromatogram signal intensities were compared to monitored phospholipid chromatogram intensities when the same sample was monitored back-to-back for peptides and phospholipids (see table S2 for phospholipid MRM transitions monitored). The signal for the extracted phospholipid chromatograms was found to be significantly lower than the signal for the peptides, nearly 3 orders of magnitude. This would indicate low abundance/presence of phospholipids in the final sample extracts, suggesting that the samples are clean and the protocol overall is safe for large-throughput studies. However, it should be noted that this may also be due to the low initial sample volume used (10 µL). Workflows requiring higher volumes of plasma may require a more extensive SPE cleanup protocol to fully remove phospholipids and other matrix components.
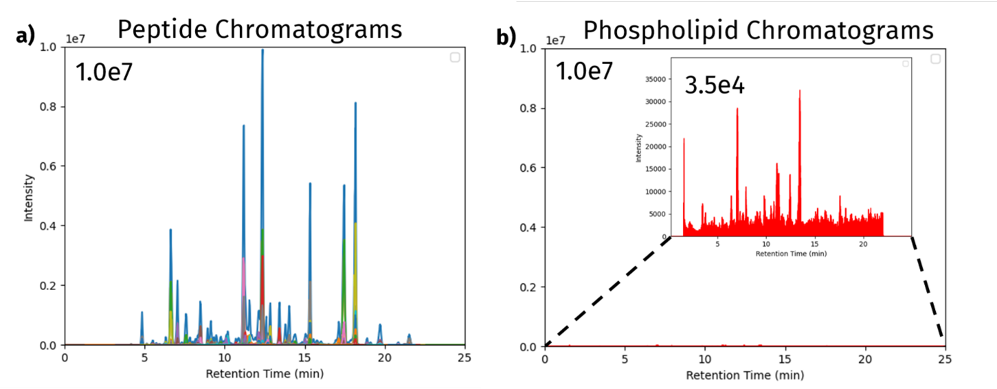 Figure 12: a) Extracted peptide chromatograms from targeted LC-MRM analysis of digested and Biotage® Sfär Bio C18 desalted/cleaned human plasma. b) Extracted phospholipid chromatograms from the same sample. A series of phospholipid MRM transitions were used to monitor the sample for common phospholipid species.
Conclusion
In this study, six Biotage reverse-phase sorbents (Biotage® Sfär C18, Biotage® Sfär Bio C18, EVOLUTE®, EVOLUTE® EXPRESS ABN, EVOLUTE® EXPRESS ABN 120 Å, ISOLUTE® C18, and ISOLUTE® C18 (EC) were evaluated for peptide desalting performance, including peptide recovery, reproducibility (CVs), retention, and matrix removal. Among the sorbents tested, Biotage® Sfär Bio C18 consistently demonstrated superior performance, delivering the highest peptide recoveries, low variability across replicates, and robust peptide retention characteristics across a wide range of peptide hydrophobicities tested. Conductivity measurements further confirmed its effective removal of buffer components, and a proof-of-concept application involving cleanup of peptides from an in-solution digestion of human plasma demonstrated its ability to generate clean peptide extracts from complex biological matrices. Collectively, these results highlight the utility of Biotage® Sfär Bio C18 as a reliable and versatile solution for peptide desalting and sample preparation, supporting robust mass spectrometry analyses in proteomics, peptide mapping, and therapeutic bioanalysis workflows where sensitivity, reproducibility, and sample cleanliness are critical.
Literature number: WP05
References
1. Mass Spec Rev. 2020;39: 2291–244.
2. Thermo Peptide Synthesis and Proteotypic Peptide Analyzing Tool, https://www.thermofisher.com/us/en/home/life-science/protein-biology/peptides-proteins/custom-peptide-synthesis-services/peptide-analyzing-tool.html
3. J. Proteome Res. 2021 Dec 3;20(12):5241-5263
4. J. Proteome Res. 2017, 16, 12, 4299–4310
5. UniProt: https://www.uniprot.org/
6. SRMAtlas: https://srmatlas.org/
7. NIST Consensus Human HCD Spectral Library: https://chemdata.nist.gov/
Materials
-
Optima acetonitrile, ACN (Fisher Scientific, Cat. No. A955)
-
Optima water, H2O (Fisher Scientific, Cat. No. W6-4)
-
Formic acid, FA (Fisher Scientific, Cat. No. A117-50)
-
Trypsin, porcine pancreas (Millipore Sigma, Cat. No. T0303-1G)
-
Bovine serum albumin, BSA (Millipore Sigma, Cat. No. A7638-250MG)
-
Chicken egg ovalbumin (Sigma, P/N: A5503-1G)
-
Myoglobin from horse heart (Millipore Sigma, Cat. No. M0630-250MG)
-
Cytochrome C from horse heart (Sigma, P/N: C2506-50MG)
-
Dithiothreitol, DTT (Sigma, P/N: D0632-1G)
-
Iodoacetamide, IAA (Sigma, P/N: I6125-5G)
-
Urea (Sigma, P/N: U5128-500G)
-
Tris base (Fisher Scientific, Cat. No. BP152-500)
-
Hydrochloric acid, HCl (Fisher Scientific, Cat. No. A466-500)
-
Guanidine-hydrochloride (Fisher Scientific, BP178-1)
-
TCEP (TCI, T1656)
-
Ammonium Bicarbonate (Thermo Scientific, Cat. No. 393212500)
Supplemental information
Table S1: Properties of peptides used for pre- and post-spike SPE studies
| Modified sequence | Protein | Length | H index | Modifications |
| G[+42]DVEK | Cytochrome C | 5 | 2.34 | Acetylated |
| IFVQK | Cytochrome C | 5 | 14.61 | |
| TGPNLHGLFGR | Cytochrome C | 11 | 25.01 | |
| TGQAPGFTYTDANK | Cytochrome C | 14 | 18.89 | |
| GITWK | Cytochrome C | 5 | 15.88 | |
| EETLMEYLENPK | Cytochrome C | 12 | 32.15 | |
| YIPGTK | Cytochrome C | 6 | 10.36 | |
| MIFAGIK | Cytochrome C | 7 | 27.42 | |
| TEREDLIAYLK | Cytochrome C | 11 | 26.99 | |
| EDLIAYLK | Cytochrome C | 8 | 27.29 | |
| EETLMEYLENPKK | Cytochrome C | 13 | 31.06 | |
| GLSDGEWQQVLNVWGK | Myoglobin | 16 | 41.59 | |
| VEADIAGHGQEVLIR | Myoglobin | 15 | 27.29 | |
| LFTGHPETLEK | Myoglobin | 11 | 23.1 | |
| HGTVVLTALGGILK | Myoglobin | 14 | 38.42 | |
| YLEFISDAIIHVLHSK | Myoglobin | 16 | 46.01 | |
| HPGDFGADAQGAMTK | Myoglobin | 15 | 20.18 | |
| ALELFR | Myoglobin | 6 | 26.75 | |
| IPIK | Myoglobin | 4 | 9.77 | |
| NDIAAK | Myoglobin | 6 | 5.13 | |
| GHHEAELKPLAQSHATK | Myoglobin | 17 | 18.04 | |
| VHHANENIFYC[+57]PIAIMSALAMVYLGAK | Ovalbumin | 27 | 51.71 | Carbamidomethylated |
| DILNQITKPNDVYSFSLASR | Ovalbumin | 20 | 39.65 | |
| YPILPEYLQC[+57]VK | Ovalbumin | 12 | 34.8 | Carbamidomethylated |
| GGLEPINFQTAADQAR | Ovalbumin | 16 | 29.09 | |
| ELINSWVESQTNGIIR | Ovalbumin | 16 | 37.76 | |
| NVLQPSSVDSQTAMVLVNAIVFK | Ovalbumin | 23 | 46.23 | |
| GLWEK | Ovalbumin | 5 | 16.2 | |
| DEDTQAMPFR | Ovalbumin | 10 | 19.14 | |
| LTEWTSSNVMEER | Ovalbumin | 13 | 26.63 | |
| ISQAVHAAHAEINEAGR | Ovalbumin | 17 | 20.99 | |
| EVVGSAEAGVDAASVSEEFR | Ovalbumin | 20 | 30.96 | |
| ADHPFLFC[+57]IK | Ovalbumin | 10 | 33.56 | Carbamidomethylated |
| HIATNAVLFFGR | Ovalbumin | 12 | 36.49 | |
| VYLPR | Ovalbumin | 5 | 15.64 | |
| AFKDEDTQAMPFR | Ovalbumin | 13 | 25.23 | |
| VTEQESKPVQMMYQIGLFR | Ovalbumin | 19 | 38.33 | |
| LPGFGDS[+80]IEAQC[+57]GTSVNVHSSLR | Ovalbumin | 23 | 31.96 | Phosphorylated, Carbamidomethylated |
| SSSANLSGISSAESLK | Ovalbumin | 16 | 24.28 | |
| ELYR | Ovalbumin | 4 | 8.71 | |
| C[+57]VSP | Ovalbumin | 4 | 1.73 | Carbamidomethylated |
| ILELPF | Ovalbumin | 6 | 32.55 | |
| GLVLIAFSQYLQQC[+57]PFDEHVK | BSA | 21 | 49.35 | Carbamidomethylated |
| LVNELTEFAK | BSA | 10 | 28.48 | |
| TC[+57]VADESHAGC[+57]EK | BSA | 13 | 6.81 | Carbamidomethylated |
| SLHTLFGDELC[+57]K | BSA | 12 | 30.18 | Carbamidomethylated |
| ETYGDMADC[+57]C[+57]EK | BSA | 12 | 13.32 | Carbamidomethylated |
| LKPDPNTLC[+57]DEFK | BSA | 13 | 25.03 | Carbamidomethylated |
| YNGVFQEC[+57]C[+57]QAEDK | BSA | 14 | 19.98 | Carbamidomethylated |
| EC[+57]C[+57]HGDLLEC[+57]ADDR | BSA | 14 | 20.09 | Carbamidomethylated |
| YIC[+57]DNQDTISSK | BSA | 12 | 14.82 | Carbamidomethylated |
| EC[+57]C[+57]DKPLLEK | BSA | 10 | 17.86 | Carbamidomethylated |
| SHC[+57]IAEVEK | BSA | 9 | 12.83 | Carbamidomethylated |
| DAIPENLPPLTADFAEDK | BSA | 18 | 35.66 | |
| DAFLGSFLYEYSR | BSA | 13 | 39.68 | |
| HPEYAVSVLLR | BSA | 11 | 32.31 | |
| EYEATLEEC[+57]C[+57]AK | BSA | 12 | 18.23 | Carbamidomethylated |
| DDPHAC[+57]YSTVFDK | BSA | 13 | 21.87 | Carbamidomethylated |
| HLVDEPQNLIK | BSA | 11 | 25.69 | |
| LGEYGFQNALIVR | BSA | 13 | 34.39 | |
| VPQVSTPTLVEVSR | BSA | 14 | 27.05 | |
| MPC[+57]TEDYLSLILNR | BSA | 14 | 43.23 | Carbamidomethylated |
| LC[+57]VLHEK | BSA | 7 | 15.76 | Carbamidomethylated |
| C[+57]C[+57]TESLVNR | BSA | 9 | 12.73 | Carbamidomethylated |
| QTALVELLK | BSA | 9 | 32.23 | |
| TVMENFVAFVDK | BSA | 12 | 37.61 | |
| EAC[+57]FAVEGPK | BSA | 10 | 19.69 | Carbamidomethylated |
| LVVSTQTALA | BSA | 10 | 23.45 | |
| NEC[+57]FLSHK | BSA | 8 | 16.6 | Carbamidomethylated |
| DDSPDLPK | BSA | 8 | 12.43 | |
| GAC[+57]LLPK | BSA | 7 | 17.65 | Carbamidomethylated |
| AEFVEVTK | BSA | 8 | 20.05 | |
| LVTDLTK | BSA | 7 | 17.02 | |
| RPC[+57]FSALTPDETYVPK | BSA | 16 | 35.93 | Carbamidomethylated |
| DLGEEHFK | BSA | 8 | 16.23 | |
| C[+57]C[+57]TKPESER | BSA | 9 | 4.51 | Carbamidomethylated |
| KFWGK | BSA | 5 | 16.34 | |
| KVPQVSTPTLVEVSR | BSA | 15 | 26.99 | |
| KQTALVELLK | BSA | 10 | 33.2 | |
| NEC[+57]FLSHKDDSPDLPK | BSA | 16 | 26.24 | Carbamidomethylated |
| DAIPENLPPLTADFAEDKDVC[+57]K | BSA | 22 | 35.96 | Carbamidomethylated |
| C[+57]C[+57]AADDKEAC[+57]FAVEGPK | BSA | 17 | 21.07 | Carbamidomethylated |
| FKDLGEEHFK | BSA | 10 | 22.54 | |
| IETMR | BSA | 5 | 8.48 | |
| AFDEK | BSA | 5 | 4.92 | |
| ADLAK | BSA | 5 | 5.48 | |
| NYQEAK | BSA | 6 | 3.1 |
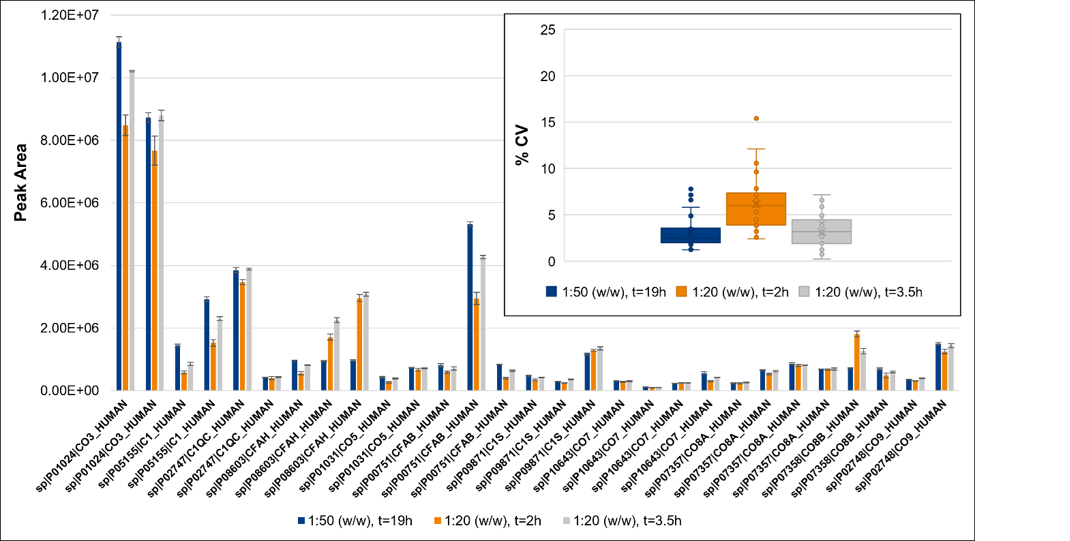 Figure S1: In-solution trypsin optimization for 1:50 (w/w) t=19 h, 1:20 t= 2 h, and 1:20 t=3.5 h. Peak areas for peptides corresponding to complement system proteins are shown in the main figure, error bars represent the standard deviation. CVs are shown in the inset figure for all peptides corresponding to complement system proteins.
Table S2: Phospholipid MRM transitions monitored
| Q1 | Q3 | Dwell time | DP | CE |
| 808.4 | 184.4 | 4 | 140 | 43 |
| 806.4 | 184.4 | 4 | 140 | 43 |
| 786.4 | 184.4 | 4 | 140 | 43 |
| 784.4 | 184.4 | 4 | 140 | 43 |
| 760.4 | 184.4 | 4 | 140 | 43 |
| 758.4 | 184.4 | 4 | 140 | 43 |
| 704.4 | 184.4 | 4 | 140 | 43 |
| 524.4 | 184.4 | 4 | 140 | 43 |
| 522.4 | 184.4 | 4 | 140 | 43 |
| 520.4 | 184.4 | 4 | 140 | 43 |
| 496.4 | 184.1 | 4 | 140 | 43 |
