Introduction
Accurate quantitation of oligonucleotides in human plasma is essential for pharmacokinetic and bioanalytical studies, particularly during clinical development and therapeutic monitoring. However, plasma is a complex biological matrix containing proteins, salts, lipids, and other endogenous compounds that can interfere with detection, suppress ionization, and compromise assay reproducibility. Effective sample preparation is therefore critical; not only to remove proteins and phospholipids that contribute to matrix effects, but also to concentrate the analyte of interest and ensure consistent recovery and sensitivity.
Mipomersen (brand name Kynamro®) is a second-generation antisense oligonucleotide (ASO) approved by the FDA in 2013 for the treatment of homozygous familial hypercholesterolemia. Chemically, mipomersen is a 20-mer single-stranded oligonucleotide with a phosphorothioate backbone. It contains 2′-O-methoxyethyl (2′-MOE) modifications at selected ribose positions and 5-methylcytosine substitutions on specific pyrimidine bases. These structural modifications enhance resistance to nuclease degradation, increase binding affinity for the target mRNA, and improve plasma stability, all of which are crucial for mipomersen’s clinical efficacy and pharmacokinetic performance.
This application note describes a solid-phase extraction (SPE) workflow for isolating mipomersen from human plasma using Biotage® Oligo SPE plates, which incorporate a novel weak anion-exchange (WAX) sorbent chemistry. The WAX retention mechanism exploits the inherent negative charge of the oligonucleotide backbone, enabling efficient binding to the sorbent and selective elution through controlled adjustments of pH and ionic strength.
Optimization of key WAX SPE parameters, such as sample and buffer pH, ionic strength, matrix pre-treatment, and the composition of wash and elution solvents, is essential to ensure robust performance and reproducible analytical results. The optimized workflow delivers high sensitivity and reliable quantification of mipomersen in plasma over a dynamic range of 25–5000 pmol/mL with ≥80 % recovery.
Analytes
 Figure 1. Molecular structure of mipomersen
Name: Mipomersen
Molecular weight: 7177.0 g·mol⁻¹
Size (mers): 20
Linkers: PO2S3-
Modifications: 2’-OMe, 5’-Me-dC
Sequence: 5'-/52MOErG/*/i2MOErC/*/i2MOErC/* /i2MOErT/*/i2MOErC/*A* G*T*/iMe-dC/* T*G*/iMe-dC/* T*T*/iMe-dC/*/i2MOErG/*/i2MOErC/*/i2MOErA/* /i2MOErC/*/32MOErC/-3'
Key:
m = 2'-OMe ribose sugar
* = phosphorothioate linker bond
r = RNA bases
/iMe-dC/ = 5-methyl deoxycytidine
/i2MOErX/ = 2'-MOE ribose sugar
Sample preparation procedure
Format
Biotage® Oligo SPE 30 mg plate, part number: 654-0030-PX01
Sample pre-treatment
All steps were performed using low-bind or polypropylene labware to minimize oligonucleotide adsorption. 2 µL of mipomersen (calibrator or QC at the required concentration) was added to 100 µL of human plasma containing sodium citrate anticoagulant. The mixture was vortexed and incubated on a laboratory shaker at room temperature for 5 minutes.
Next, 100 µL of lysis buffer was added to the spiked plasma, followed by vortexing and incubation on a laboratory shaker for 5 minutes. The mixture was then combined with 500 µL of 50 mM ammonium acetate (pH 5.5), vortexed, and further incubated on the shaker for an additional 5 minutes.
This preparation resulted in a plasma:lysis buffer:ammonium acetate ratio of 1:1:5 (v/v), and the resulting mixture was used as the sample load for the SPE procedure.
Preliminary experiments on recovery were conducted using 100 µL of human plasma spiked with 10 µL of mipomersen (10 pmol/µL).
Solid-phase extraction procedure
Pre-treated plasma was extracted using the Biotage® Oligo SPE 30 mg 96-well plate. For manual processing, the Biotage® PRESSURE+ 96 Positive Pressure Manifold was used at ~1 psi (fine control setting) for all steps, except the plate drying step, which was performed at ~20 psi (coarse control setting). The higher pressure was applied after wash 3 and again following elution, gradually increasing from fine to coarse control to reach ~20 psi. Automated processing was performed using the Biotage® Extrahera™ Classic.
The full extraction protocol is demonstrated in Table 1.
Table 1. Mipomersen SPE extraction procedure
|
Step |
Buffer |
Volume |
|
Condition |
Methanol |
1 mL |
|
Equilibration |
50 mM ammonium acetate aq. pH 5.5 |
1 mL |
|
Sample load |
Pre-treated plasma |
700 µL |
|
Wash 1 |
50 mM ammonium acetate aq. pH 5.5 |
1 mL |
|
Wash 2 |
50/50 (v/v) 50 mM ammonium acetate aq. pH 5.5/ acetonitrile (total ionic strength 25 mM) |
1 mL |
|
Wash 3 |
25/75 (v/v) 200 mM ammonium bicarbonate aq. pH 9/ acetonitrile (total ionic strength 50 mM) |
1 mL |
|
Dry |
1 minute at 20 psi |
|
|
Elution |
50/50 (v/v) 200 mM ammonium bicarbonate aq. pH 10/ acetonitrile (total ionic strength 100 mM) |
500 µL |
|
Dry |
1 minute at 20 psi |
|
Note: Ionic strength of wash/elution solvents is important. Guidelines for preparation are provided in the reagent preparation section.
Post-extraction
500 µL extracts were evaporated in 96-well collection plates using the TurboVap® 96 Dual with following parameters:
Gas Temp: 60 °C
Plate Temp: 60 °C
Gas Flow: 60 L/min
Plate Height: 48 mm
Time: 50 min
Extracts were reconstituted in 200 µL of mobile phase A:B (5:95). The plate was covered with a sealing mat and vortex-mixed for 25–30 min prior to LC–MS analysis.
Note: Reconstituted extracts were subjected to increased mixing times to ensure complete solubilization of the oligonucleotide, to prevent adsorption losses, and to produce a homogeneous solution for analysis.
The reconstitution solvent described above is optimized for hydrophilic interaction liquid chromatography (HILIC) separation as used in this application note. Extracts prepared using Biotage® Oligo SPE products are also compatible with the commonly used reversed-phase ion-pair (RP-IP) approach. The reconstitution solvent should therefore be adjusted to match the initial conditions of the chromatographic method used.
Analytical conditions
UHPLC Conditions
-
Instrument: Waters ACQUITY Premier UPLC System with FTN Sample Manager
-
Column: ACQUITY Premier BEH Amide VanGuardTM FIT UPLC 1.7 µm (50 x 2.1 mm), p/n 186009507 with a ACQUITY Premier BEH Amide VanGuardTM cartridge 1.7 µm (5 x 2.1 mm), p/n 186009510
-
Mobile Phase A: 30 mM ammonium acetate + 0.04% NH₄OH in 70:30 (v/v) water:acetonitrile, pH 8.8
-
Mobile Phase B: 30 mM ammonium acetate + 0.04% NH₄OH in 30:70 (v/v) water:acetonitrile, pH 8.8
-
Strong wash: water: acetonitrile (70:30, v/v)
-
Purge/weak needle wash: water:acetonitrile (10:90, v/v)
-
Seal wash: water:methanol (50:50, v/v)
-
Flow rate: 0.5 mL/min
-
Injection volume: 10 µL
-
Column temperature: 40 °C
-
Sample temperature: 10 °C
Table 2: UHPLC gradient conditions
|
Time (min) |
% A |
% B |
Curve |
|
0 |
5.0 |
95.0 |
Initial |
|
1.50 |
35.0 |
65.0 |
6 |
|
5.00 |
90.0 |
10.0 |
6 |
|
5.0 |
95.0 |
6 |
Note: The LC flow state was diverted to waste initially and then set to MS at 0.8 mins followed by waste from 2.5 mins onwards.
MS/MS conditions
Mass analysis was performed using a Waters Xevo TQ Absolute triple quadrupole mass spectrometer (Waters Assoc., Manchester, UK) equipped with an electrospray interface. Table 3 show the negative ions acquired in the multiple reaction monitoring (MRM) mode.
-
Instrument: Waters Xevo TQ Absolute XR
-
Ionization mode: ESI -
-
Acquisition mode: MRM
-
Desolvation Temperature: 600 °C
-
Capillary Voltage: 2.00 kV
-
Desolvation Gas Flow: 1000 L/hr
-
Cone Gas Flow: 150 L/hr
-
Source Temperature: 150 °C
Table 3: MRM Parameters
|
Analyte |
Retention time (min) |
MRM transition |
Precursor charge |
Cone voltage (V) |
Collision energy (eV) |
|
Mipomersen (Quantifier) |
1.58 |
1434.3 > 94.9 |
-5 |
10 |
35 |
|
Mipomersen (Qualifier 1) |
1.58 |
1793.4 > 94.8 |
-4 |
60 |
40 |
|
Mipomersen (Qualifier 2) |
1.58 |
1434.3 > 1434.3 |
-5 |
10 |
4 |
Note: MRM parameters for mipomersen were automatically set using the auto-dwell function. Although the parent-to-parent MRM approach is less selective, it provides an additional option for qualifier ions.
Full scan MS was used to identify suitable precursor ions for MS/MS analysis and to assess mipomersen’s ionization behavior under electrospray conditions. Multiple charge states were observed, with the dominant precursors highlighted in the representative full scan MS spectrum shown in Figure 2. The charge state distribution provides insight into the ionization behaviour of mipomersen and is an important consideration for downstream MRM method development.
The most dominant product ion for mipomersen was observed at m/z 95, corresponding to a stable phosphate-related fragment from the oligonucleotide backbone. This ion is consistently generated from both phosphodiester and phosphorothioate oligonucleotides and provides high signal-to-noise and sensitivity for MRM quantitation. For plasma analysis, higher charge state precursors were selected for quantitation, as they provided improved sensitivity compared to lower charge state ions.
Spectra acquired using HILIC ESI-MS exhibited fewer charge states than those obtained with RP-IP separations. This reduction in charge multiplicity under HILIC conditions simplifies spectral interpretation and facilitates precursor selection for quantitative analysis.
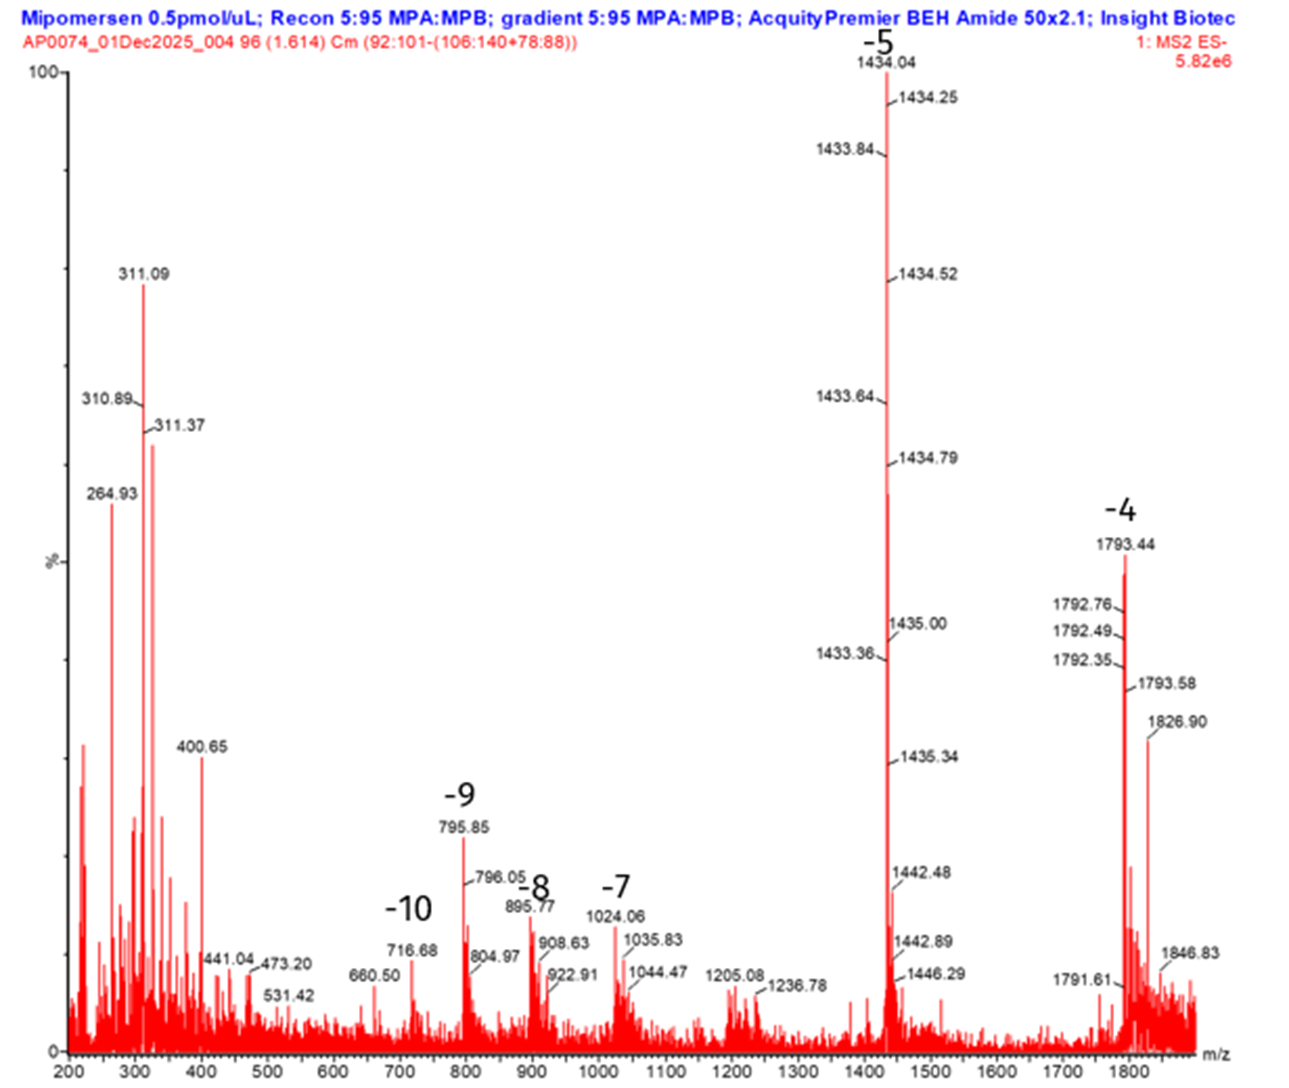
Figure 2. Full scan of mipomersen charge states
Results
Extraction recoveries
Recoveries of mipomersen from plasma were consistently ≥80 % on both manual and automated platforms, demonstrating robust and reproducible extraction efficiency across workflows, see Figure 3. The effect of anticoagulant type on mipomersen recovery was evaluated. Plasma collected with sodium citrate, K₃EDTA, or NaEDTA exhibited comparable recoveries, demonstrating the method’s robustness across these matrices. In contrast, recoveries from lithium heparin and sodium heparin plasma were approximately 10 % lower, indicating a moderate anticoagulant-dependent effect, see Figure 4.
Optimization of the aqueous/organic composition of wash 3 and the sample pre-treatment ratio of lysis buffer further improved method performance, see Figure 5. Increasing the acetonitrile percentage in wash 3 reduced matrix effects, resulting in higher matrix factor values, see Figure 6.
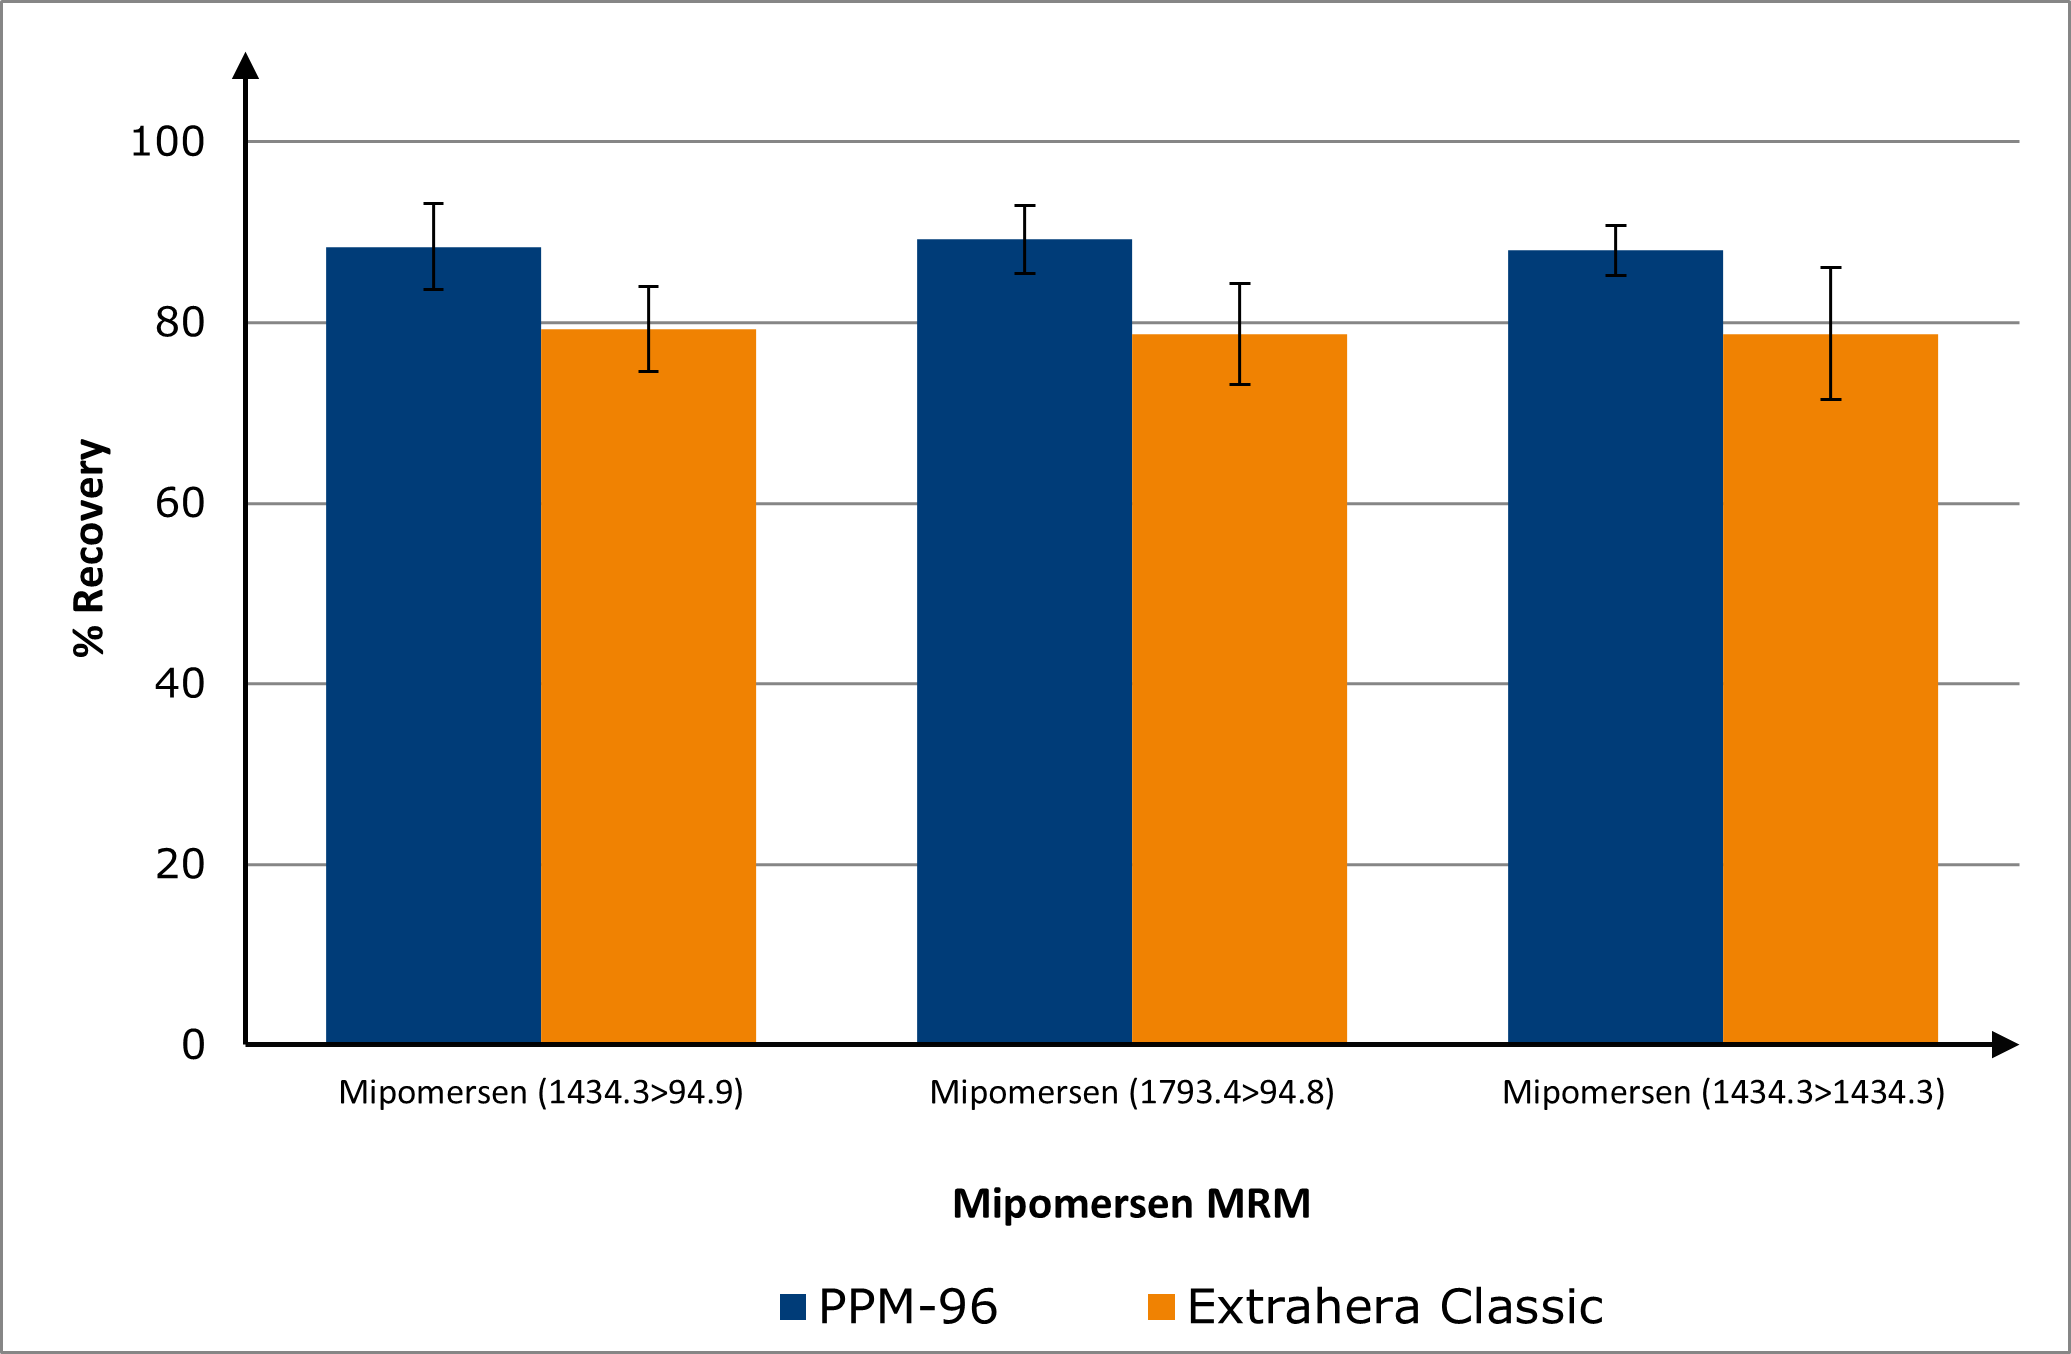
Figure 3. Biotage® PRESSURE+ 96 (PPM-96) vs Biotage® Extrahera™ recoveries
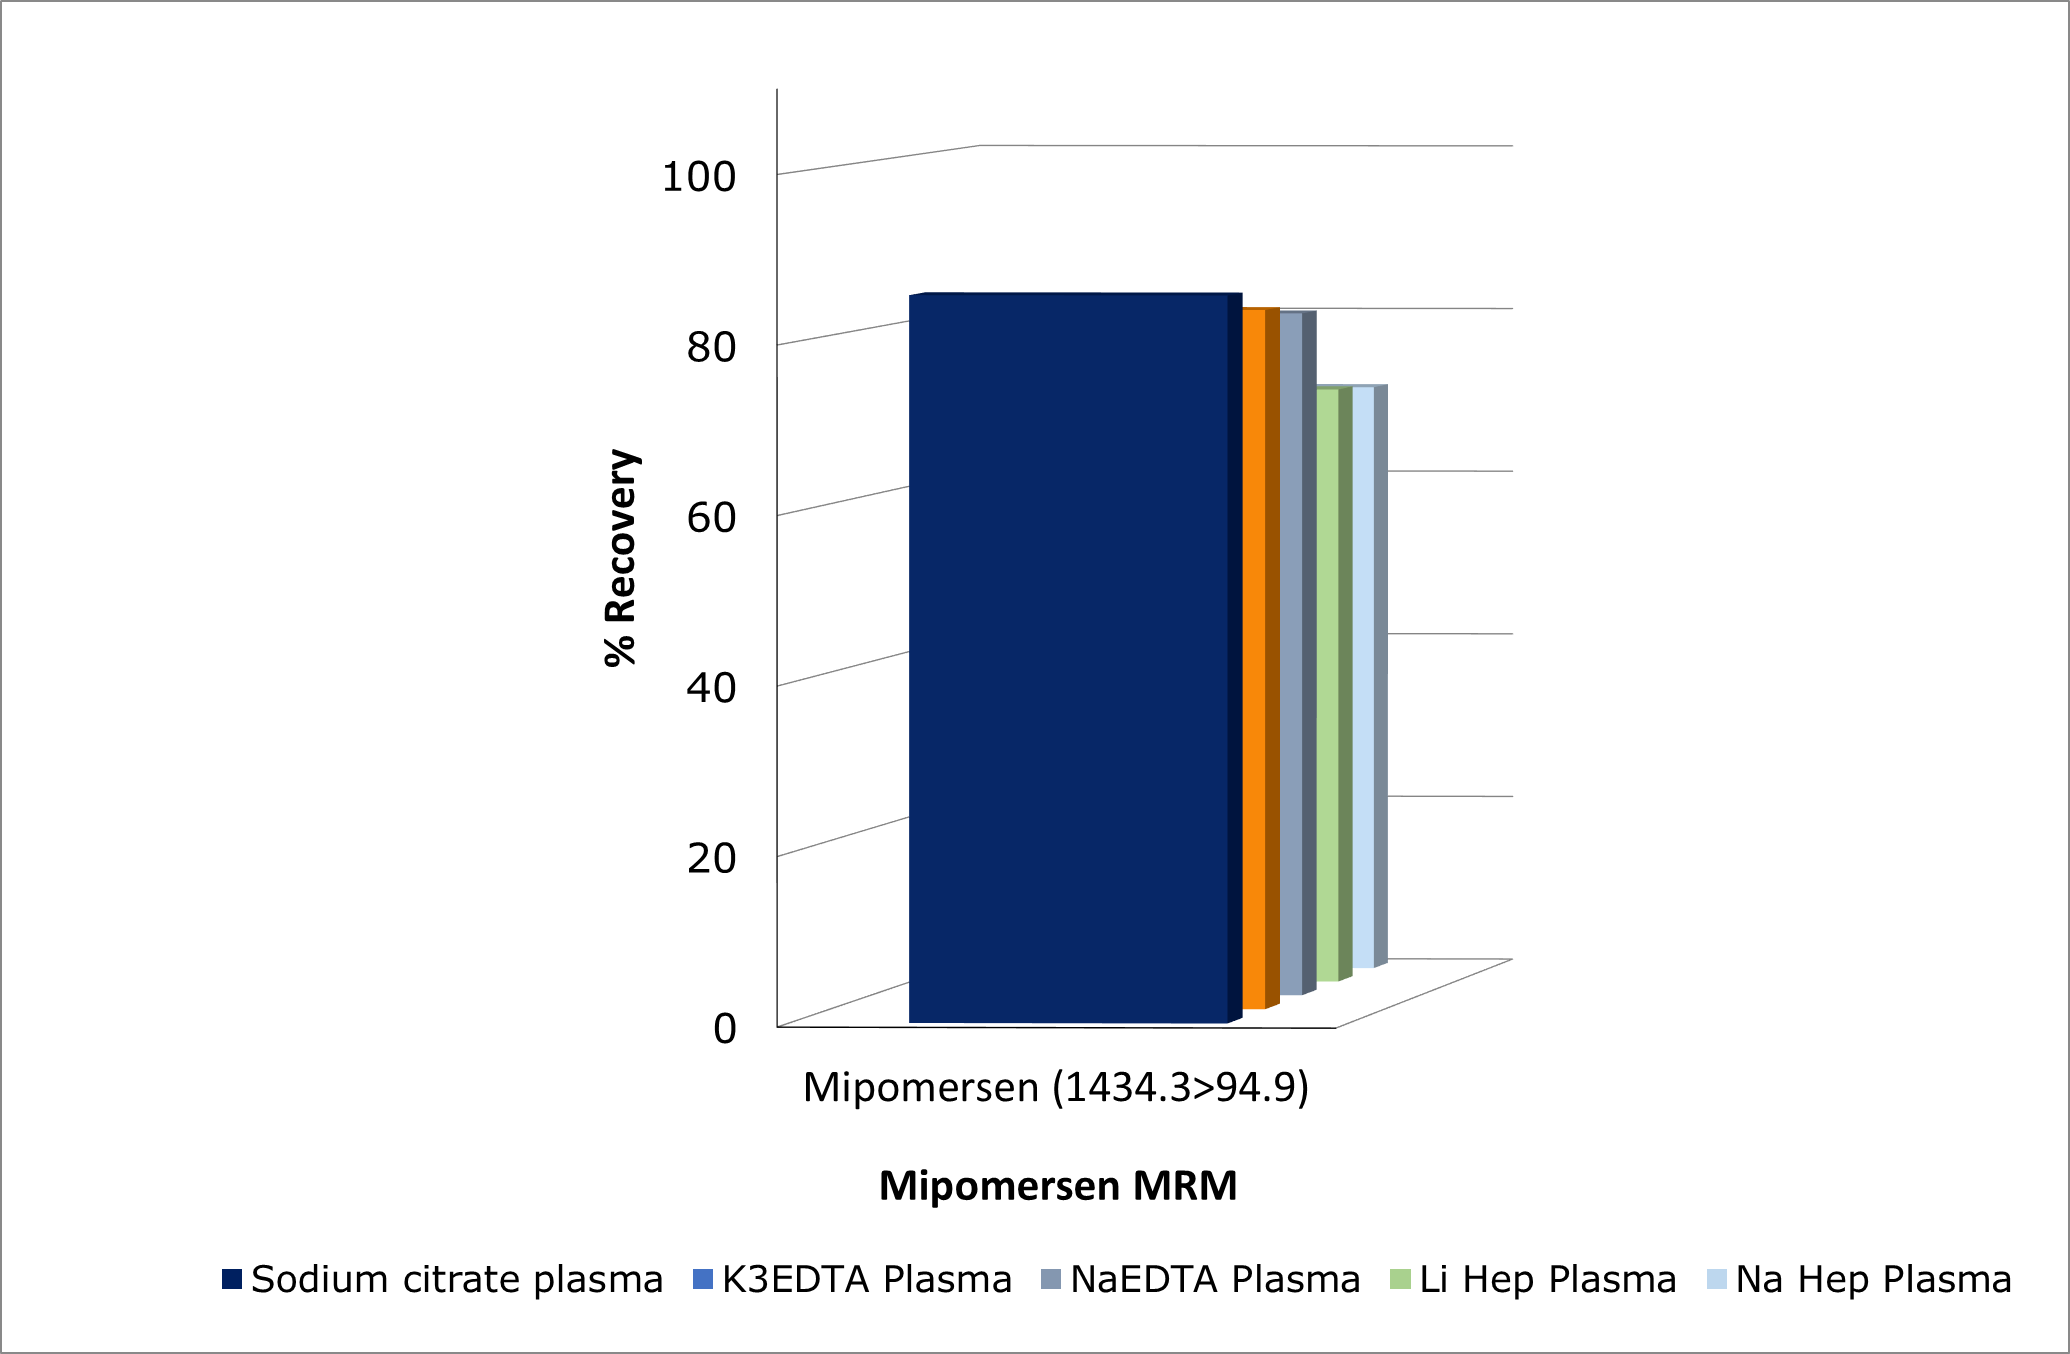
Figure 4. Investigating effects of different plasma anti-coagulants on mipomersen recovery
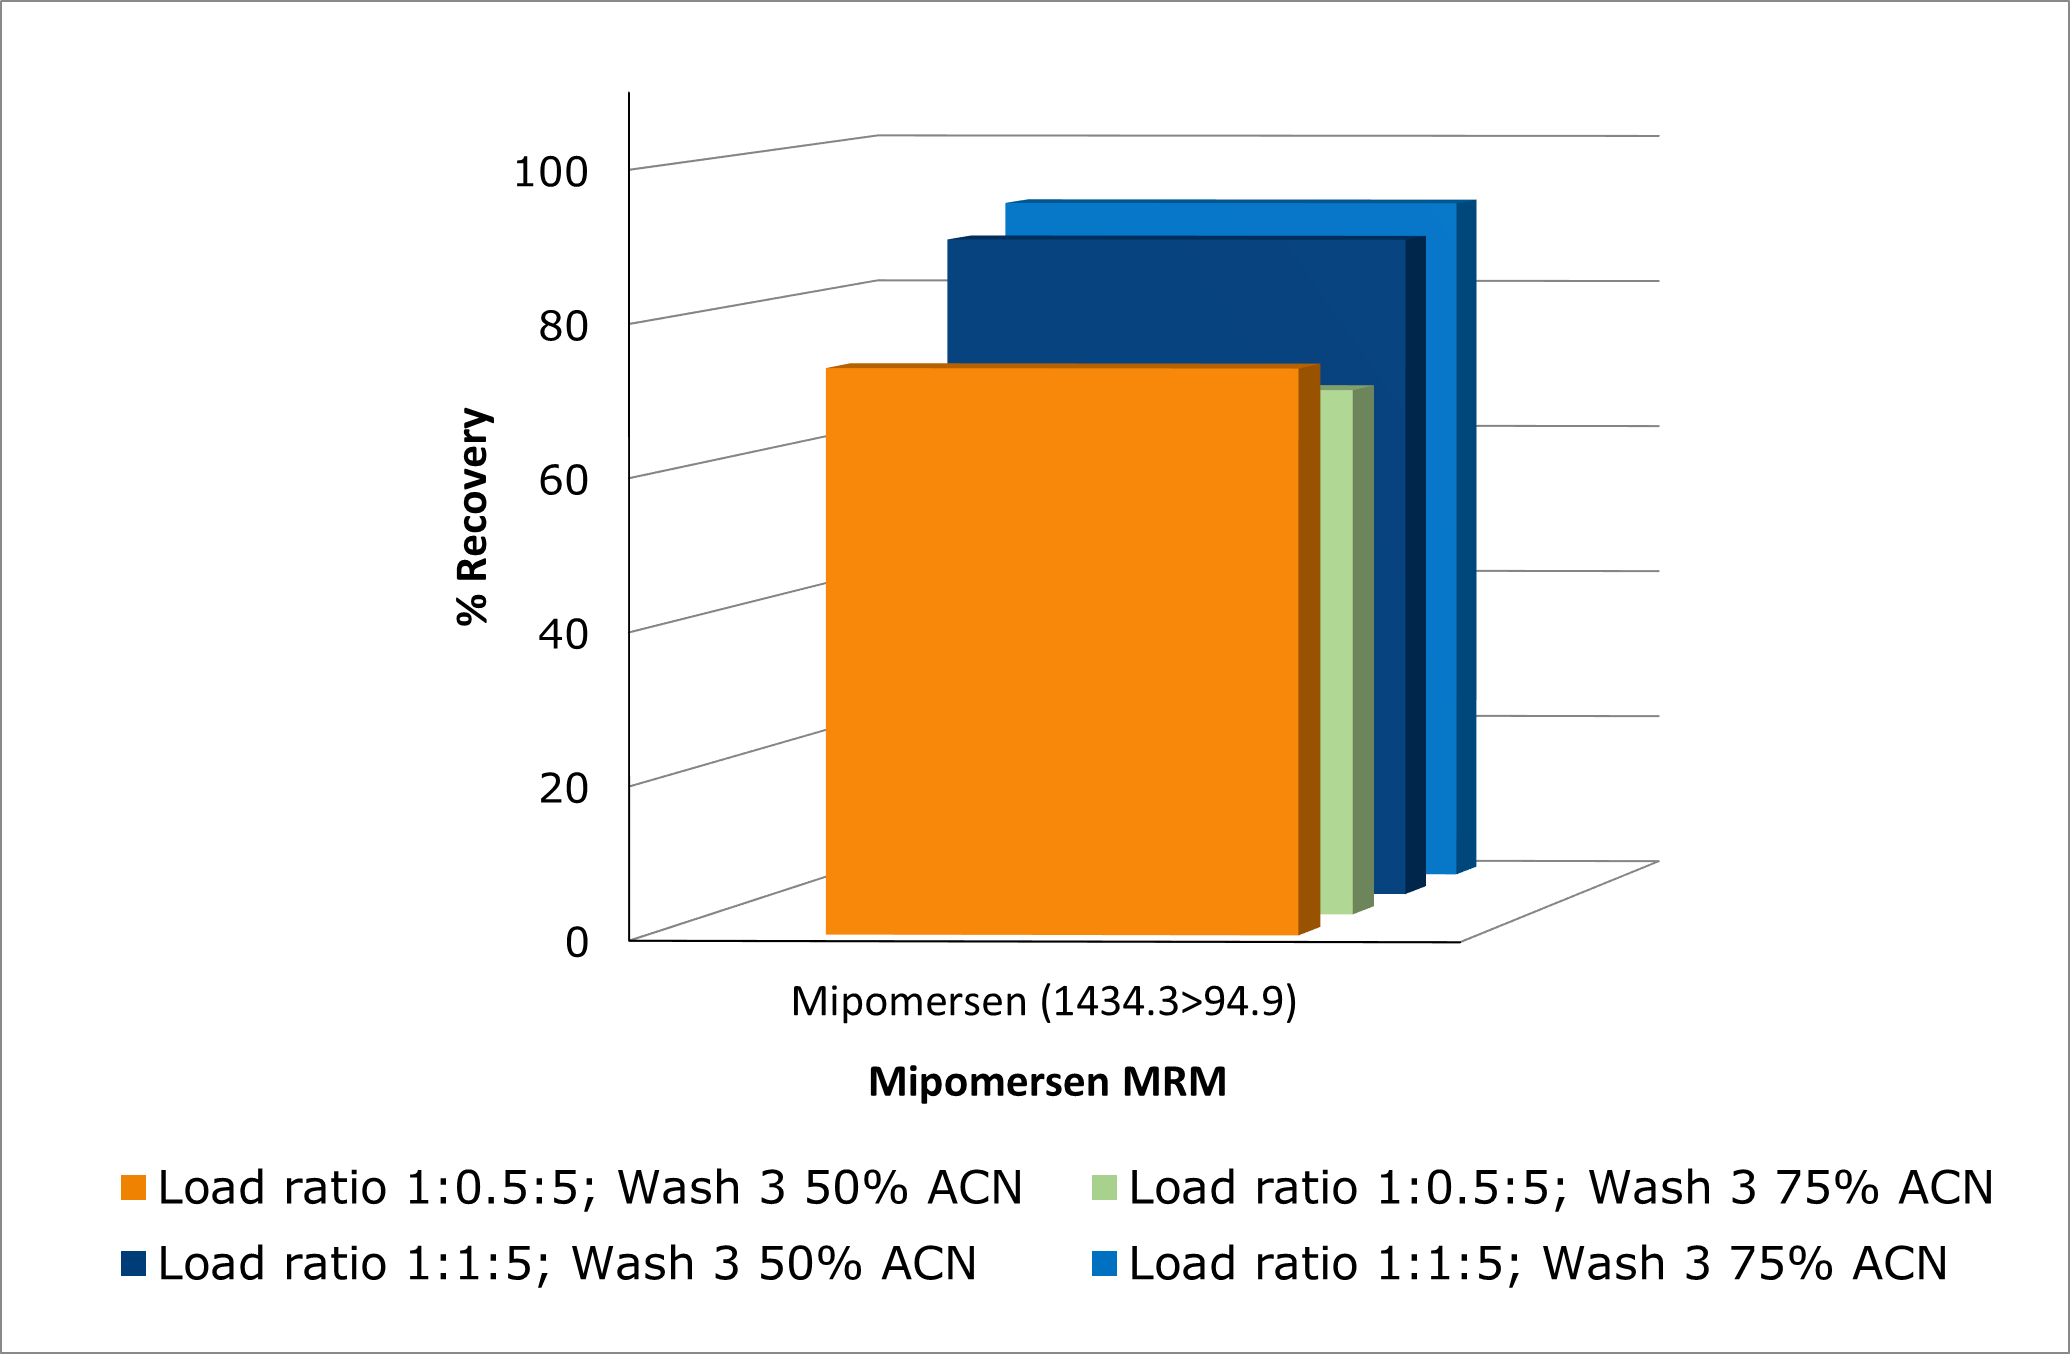
Figure 5. Investigating effects of load ratio and increase in % of ACN in wash 3 on mipomersen recovery
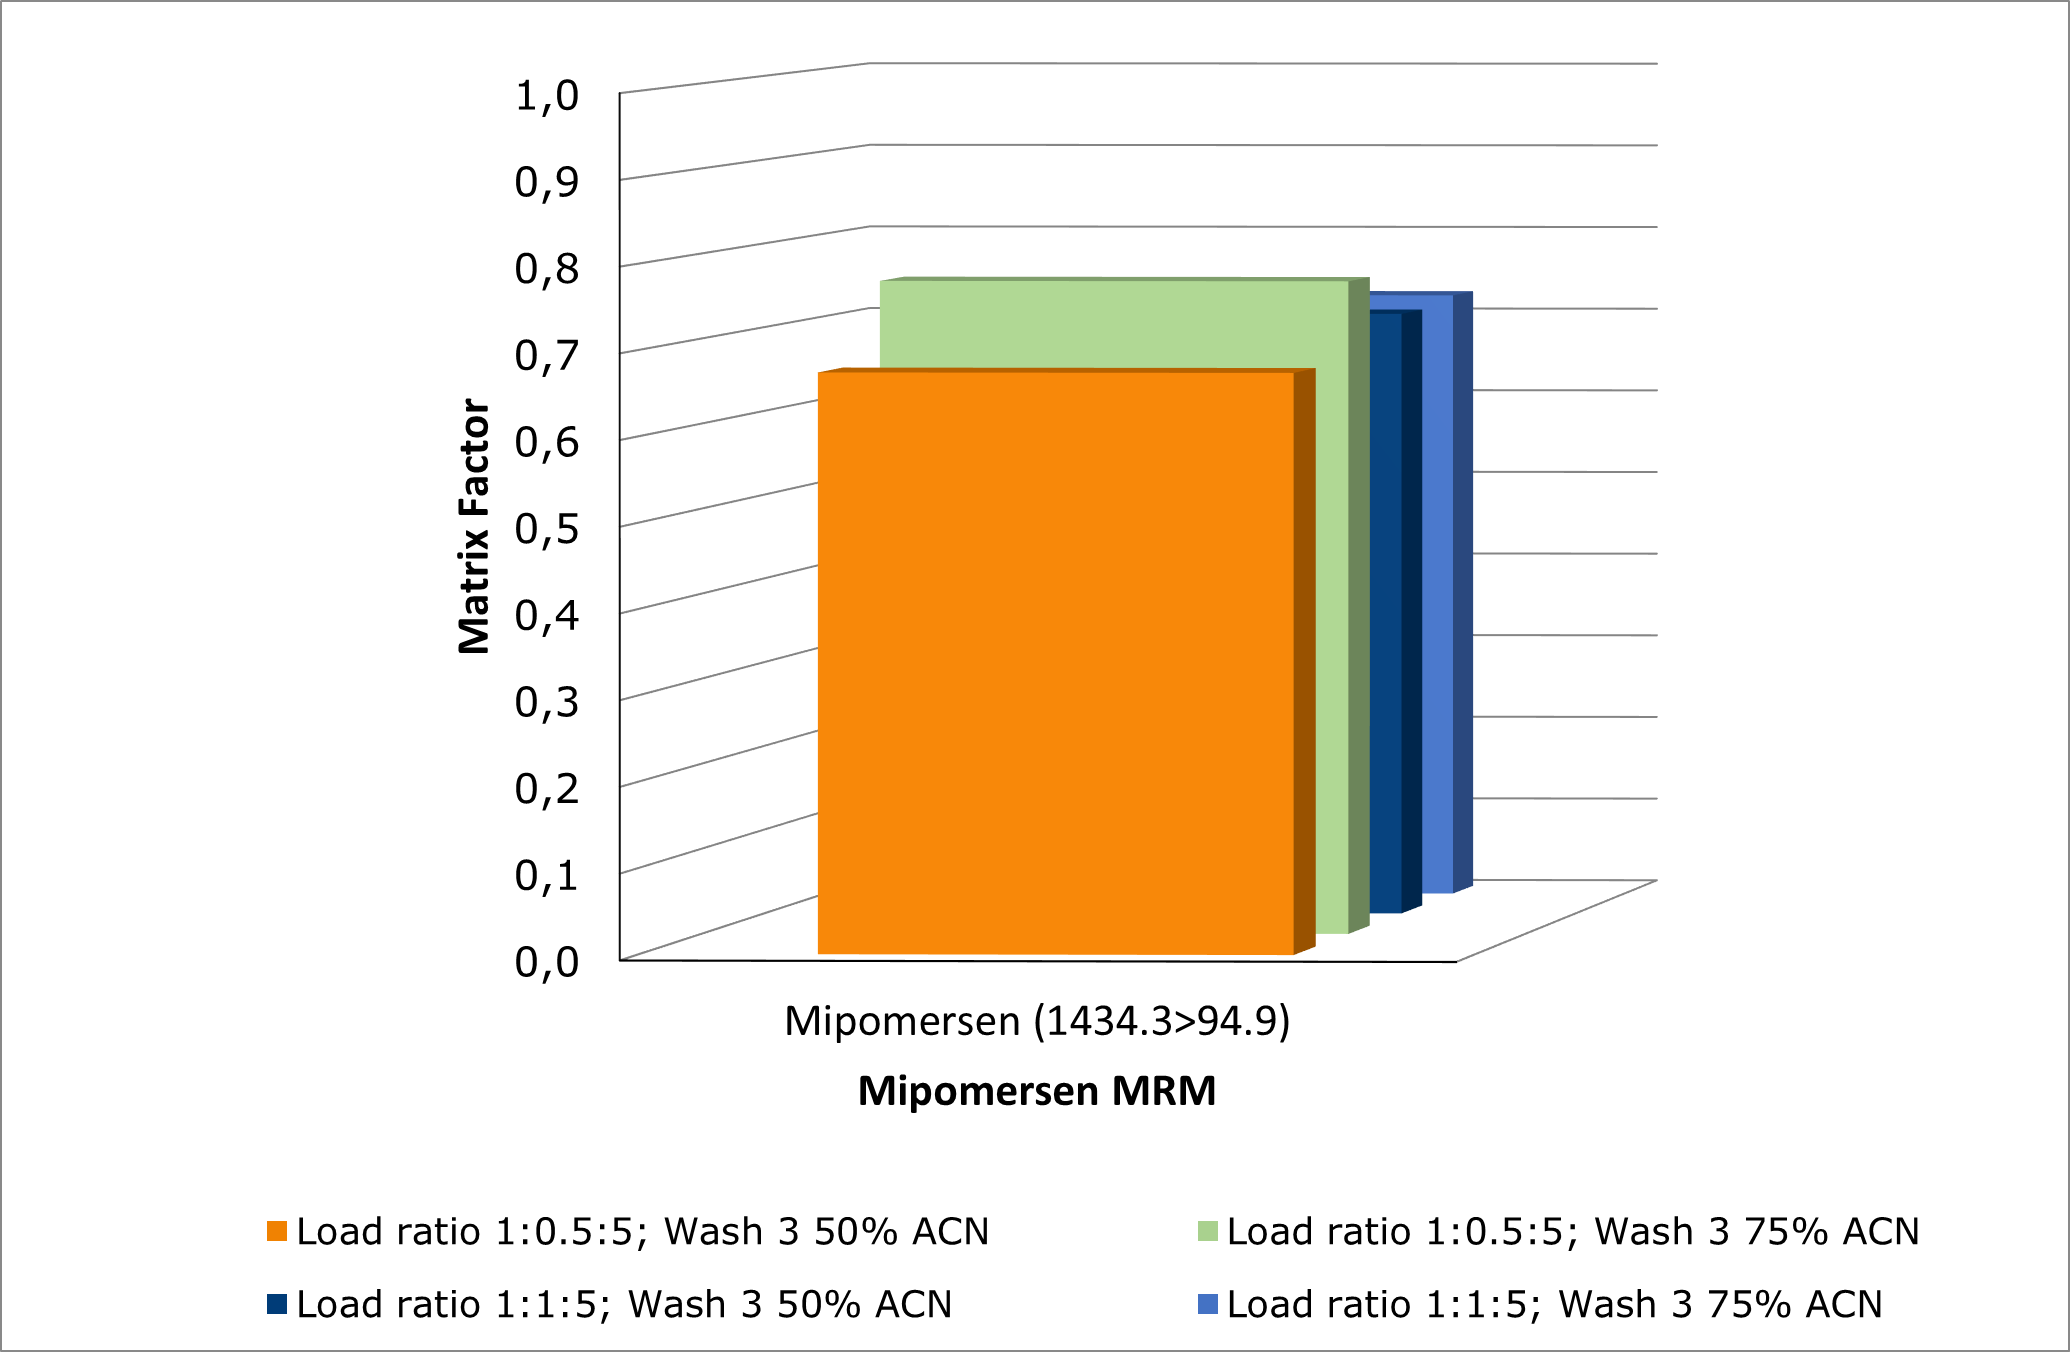
Figure 6. Investigating effects of sample:buffer load ratio and increase in % of ACN in wash 3 on mipomersen matrix factor
Extract cleanliness
Extract cleanliness was assessed to confirm removal of endogenous matrix components. SDS-PAGE analysis comparing blank plasma with Biotage® Oligo SPE processed plasma extracts showed that untreated plasma contained multiple high and low molecular weight protein bands, whereas no protein bands were visible in the SPE processed samples. This demonstrates effective protein removal and improved sample cleanliness following SPE clean-up, see Figure 7.
 Figure 7. SDS-PAGE comparison of blank plasma and Biotage® Oligo SPE processed plasma extracts.
Phospholipid profiling confirmed removal of phosphatidylcholine (PC) and lysophosphatidylcholine (LPC), two major ion-suppressing phospholipid classes in plasma. SPE provided markedly cleaner extracts than protein precipitation, as shown in Figure 8.
 Figure 8. Total ion chromatograms (TICs) showing phospholipid removal of PC (top chromatogram) and LPC (bottom chromatogram) from plasma using Biotage® Oligo SPE compared to classic protein precipitation.
Finally, full scan MS analysis demonstrated complete removal of surfactant-derived signals in the SPE treated extracts. As shown in Figure 9, the lysis buffer control exhibited abundant surfactant-related signals between retention times 1.00 – 3.50 mins, whereas the SPE extract effectively eliminated this background, confirming improved clean-up and enhanced sample cleanliness. This ensures compatibility with downstream LC-MS/MS analysis and minimizes risk of ion suppression and contamination.
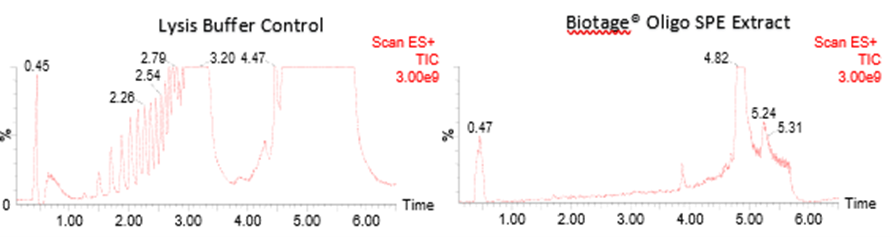
Figure 9. Full-scan total ion chromatograms (TICs) comparing a lysis buffer control (LHS) and a Biotage® Oligo SPE treated extract (RHS).
Linearity and LOQ
Calibration curves were constructed using plasma spiked between 25-5000 pmol/mL and extracted in duplicate. A 1/x weighted linear regression model was applied to generate the calibration and determine the correlation coefficient. No internal standards were used in this study, highlighting the reproducibility of uncorrected data and the robustness of the method. A representative calibration curve is shown in Figure 10. Good linearity was obtained over the concentration range investigated, with coefficient of determination (r2) greater than 0.99, see Tables 4 and 5. The limit of quantification (LOQ) was defined as the lowest concentration at which the analyte gave a signal to noise ratio of at least 10:1.
For precision and accuracy, three QC levels (low, medium and high) were analyzed in n=5. Accuracy was calculated as the mean relative error from the target concentration and precision was evaluated as the relative standard deviation (RSD %). Calibration standards and QCs were considered acceptable if they were within ±15 % of their nominal concentrations, except for the LOQ and lowest QC, which were allowed ±20 %. Precision and accuracy results for mipomersen using manual and automated processing workflows are summarized in Tables 6 and 7, respectively.
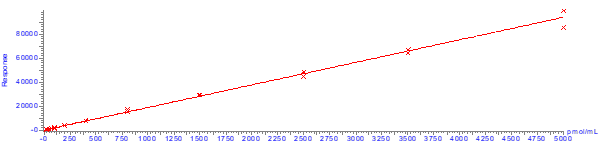
Figure 10. Calibration plot for mipomersen quantifier ion (1434.3 > 94.9) on Biotage® Extrahera™.
Table 4: Calibrators and QC concentrations used to create calibration curves
|
Calibrator or QC |
Mipomersen conc. (pmol/mL) |
|
S0 |
0 |
|
S1 |
25 |
|
S2 |
35 |
|
S3 |
50 |
|
S4 |
75 |
|
S5 |
100 |
|
S6 |
200 |
|
S7 |
400 |
|
S8 |
800 |
|
S9 |
1500 |
|
S10 |
2500 |
|
S11 |
3500 |
|
S12 |
5000 |
|
LQC |
120 |
|
MQC |
1500 |
|
HQC |
4000 |
Table 5. Linearity and LOQ for mipomersen quantifier and qualifier ions
|
Plate processing |
r2 Quantifier (1434.3 > 94.9) |
r2 Qualifier 1 (1793.4 > 94.8) |
r2 Qualifier 2 (1434.3 > 1434.3) |
LOQ (pmol/mL) |
|
Biotage® PRESSURE+ 96 |
0.994 |
0.997 |
0.997 |
25 |
|
Biotage® Extrahera™ |
0.996 |
0.996 |
0.995 |
25 |
Table 6. QC precision and accuracy using Biotage® PRESSURE+ 96 manual processing workflow
|
QC Level |
Target concentration (pmol/mL) |
Number of determinations |
Mean calculated concentration (pmol/mL) |
RSD (%) |
Accuracy (%) |
|
LQC |
120 |
5 |
99.80 |
2.4 |
83.2 |
|
MQC |
1500 |
5 |
1534.29 |
2.8 |
102.3 |
|
HQC |
4000 |
5 |
4144.93 |
3.9 |
103.6 |
Table 7. QC precision and accuracy using Biotage® Extrahera™ automated processing workflow
|
QC level |
Target concentration (pmol/mL) |
Number of determinations |
Mean calculated concentration (pmol/mL) |
RSD (%) |
Accuracy (%) |
|
LQC |
120 |
5 |
118.94 |
7.9 |
99.1 |
|
MQC |
1500 |
5 |
1444.60 |
9.0 |
96.3 |
|
HQC |
4000 |
5 |
3888.24 |
7.3 |
97.2 |
Conclusion
An SPE method using Biotage® Oligo SPE 30 mg plate was optimized and developed for the extraction of mipomersen from human plasma. The method demonstrated excellent quantitative performance with linear calibration curves obtained without an internal standard across the range of 25–5000 pmol/mL. 1/x weighted regression yielded correlation coefficients (R²) ≥0.99, confirming linearity across the investigated range.
High and reproducible recoveries (≥80 %) were achieved, demonstrating the robustness of the SPE workflow. Equivalent performance was observed when samples were processed using either the manual Biotage® PRESSURE+ 96 or the Biotage® Extrahera™ automated platform, enabling seamless transfer from method development to high-throughput analysis.
Using either the manual or automated workflow described here, a full 96-sample batch can be prepared in approximately 3 hours, from initial sample preparation to ready-to-inject extracts.
Matrix effects were well controlled, with matrix factors around 0.7 (including evaporative losses), indicating effective reduction of ion suppression. Excellent clean-up was demonstrated by SDS-PAGE analysis and LC-MS TICs, showing effective removal of plasma proteins, phospholipids, and surfactants following SPE.
All data were generated using HILIC chromatographic separation. Although sensitivity differences between HILIC and RP-IP chromatography were not evaluated, the observed linearity, recoveries, and extract cleanliness demonstrate that this SPE procedure is suitable for quantitative analysis of oligonucleotides in plasma by LC-MS/MS.
Chemicals, reagents and matrix
- Mipomersen sodium standard was obtained from Insight Biotechnology (Wembley, UK)
- All solvents were HPLC grade from Rathburn Chemicals Ltd. (Scotland, UK)
- Nuclease-free water was purchased from Fisher Scientific (Loughborough, UK)
- Analytical grade reagents were from Sigma-Aldrich (Gillingham, UK).
- LC-grade water at 18 MΩ was obtained fresh daily from a Direct-Q 5 water purifier from Merck Life Science (Watford, UK)
- Plasma (sodium citrate, K3EDTA, NaEDTA, lithium heparin and sodium heparin) were purchased from the Welsh Blood Service (Pontyclun, UK).
Additional information
Mipopersen stock and working solution
Mipomersen stock was made up in nuclease-free water at a concentration of 1 mg/mL (1000 pmol/µL). An intermediate solution was then prepared by diluting the stock to 400 pmol/µL in water:acetonitrile (20:80, v/v). All working solutions were prepared from this intermediate solution using serial dilutions in 20:80 (v/v) water:acetonitrile. All mipomersen solutions were stored at -20 °C.
Reagent preparation
Equilibration buffer and wash 1: 50 mM ammonium acetate aq. (pH 5.5)
Dissolve 3.85 g ammonium acetate (MW = 77.08 g.mol-1) in 900 mL water, adjust pH to 5.5 using glacial acetic acid. Bring volume to 1 L and store at room temperature for up to 1 week.
Wash 2: 50/50 (v/v) 50 mM ammonium acetate aq. (pH 5.5) / acetonitrile
Mix 200 mL 50 mM ammonium acetate aq. pH 5.5 with 200 mL acetonitrile and store at room temperature for up to 1 week.
Wash 3: 25/75 (v/v) 200 mM ammonium bicarbonate aq. (pH 9) / acetonitrile
Dissolve 1.58 g ammonium bicarbonate (MW = 79.06 g·mol-1) in 80 mL water, sonicate for 1 min to aid solubility, adjust pH to 9 by using 25 % ammonium hydroxide. Bring volume to 100 mL and add 300 mL acetonitrile. Store at room temperature for up to 1 week.
Elution buffer: 50/50 (v/v) 200 mM ammonium bicarbonate aq. (pH 10) / acetonitrile
Dissolve 1.58 g ammonium bicarbonate (MW = 79.06 g·mol-1) in 80 mL water, sonicate for 1 min to aid solubility, adjust pH to 10 by using 25 % ammonium hydroxide. Bring volume to 100 mL and add 100 mL acetonitrile. Store at room temperature for up to 1 week.
Lysis Buffer
The lysis buffer consisted of guanidine hydrochloride (6 M), TCEP hydrochloride (7 mM), urea (2 M), citric acid (4 mM), L-cysteine (8 mM), and 2 % (v/v) non-ionic surfactant (Triton X-100 or tergitol).
Dissolve 57.32 g guanidine hydrochloride (MW= 95.53 g·mol-1) in approximately 40 mL water with sonication to aid solubility. Add 12.01 g urea (MW= 60.06 g·mol-1) and sonicate until fully dissolved, then add 0.08 g citric acid (MW = 192.12 g·mol-1), 0.20 g TCEP (MW = 286.65 g·mol-1), and 0.097 g L-cysteine (MW = 121.16 g·mol-1), sonicating briefly after each addition. Adjust the pH to 2.5 by using glacial acetic acid. Bring the volume to 98 mL with water, add 2 mL surfactant (Triton X-100 or tergitol), and mix thoroughly. Store at 4 oC for up to 2 weeks.
Literature number: AN1027
