For research use only. NOT for use in diagnostic procedures.
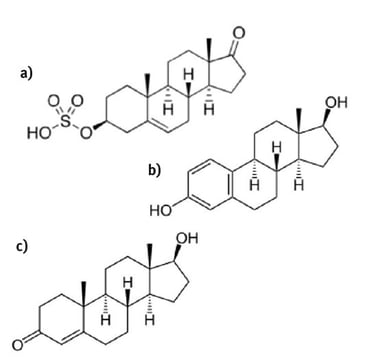
Figure 1. Structures of (a) DHEAS, (b) Estradiol and (c) Testosterone.
Introduction
This application note describes the extraction of a panel of 19 steroid hormones from human urine using ISOLUTE® SLE+ Supported Liquid Extraction plates prior to LC/MS-MS analysis. The simple sample preparation procedure delivers clean extracts and analyte recoveries greater than 90% with RSDs lower than 10% for all analytes. Linearity of greater than 0.999 is achieved for all analytes in the range 1-1000 pg/mL.
Manual sample preparation was performed using the Biotage® Pressure+ 96 Positive Pressure Manifold. The sample prepara- tion method is automatable using the Biotage® ExtraheraTM. See Appendix for automation parameters and comparative data generated using the automated method.
ISOLUTE® SLE+ Supported Liquid Extraction products offer an efficient alternative to traditional liquid-liquid extraction (LLE) for bioanalytical sample preparation, providing high analyte recoveries, no emulsion formation, and significantly reduced sample preparation.
Analytes
Cortisol, 18-OH-Corticosterone, 21-Deoxycortisol, Cortisone, Estradiol, 17-OH-Pregnenolone, Aldosterone, 11-Deoxycortisol, Corticosterone, Estrone, Dehydroepiandrosterone (DHEA), 17-OH-Progesterone, Dehydroepiandrosterone sulfate (DHEAS), Testosterone, Dihydrotestosterone (DHT), Pregnenolone, Androstenedione, 11-deoxycorticosterone, Progesterone
Internal standards
Dihydrotestosterone-D3 (DHT-D3) and Aldosterone-D4
Sample preparation procedure
Format
ISOLUTE® SLE+ 400 µL sample capacity plate, (p/n) 820-0400-P01
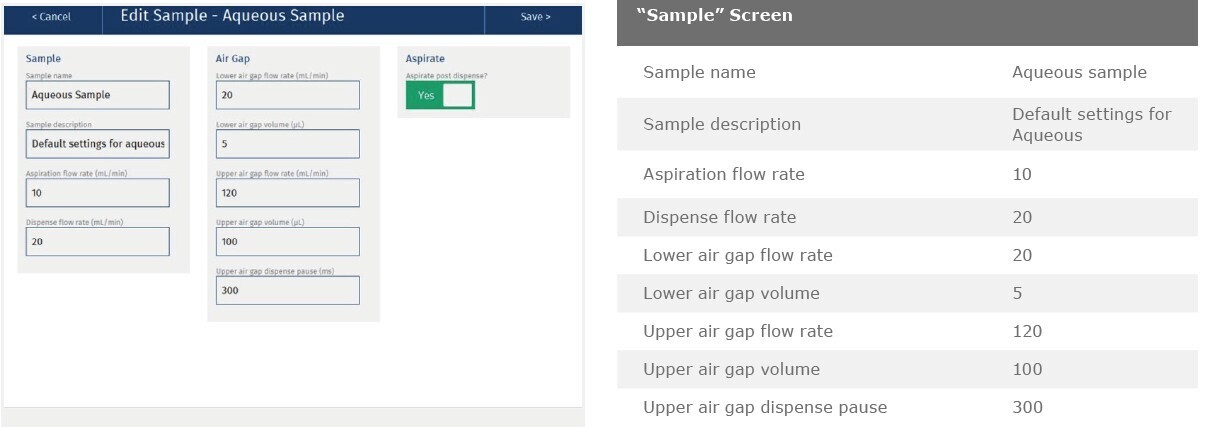
Sample pre-treatment
Add 10 µL of a 100 pg/µL methanolic ISTD solution to 1 mL of human urine and mix to give a final concentration of 1 ng/mL.
Sample loading
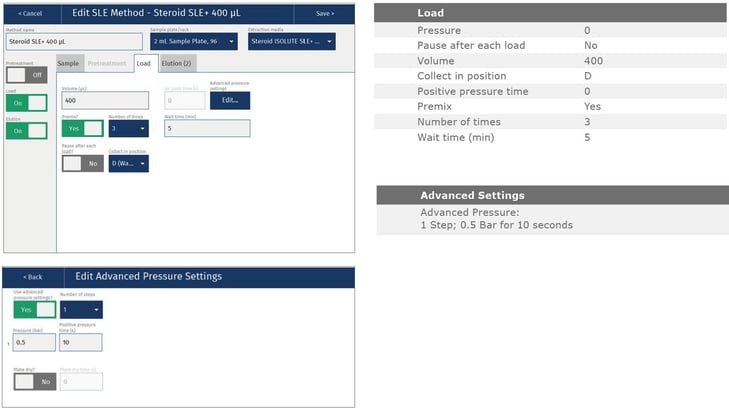
Apply up to 400 µL of pre-treated sample into each well of the ISOLUTE SLE+ plate. Using a Biotage® PRESSURE+96 Positive Pressure Manifold*, apply a pulse of pressure (2–5 psi) to load samples onto the sorbent. Wait 5 minutes for the sample to equilibrate on the sorbent.
*Conditions for automated processing using Biotage® Extrahera are shown in Appendix.
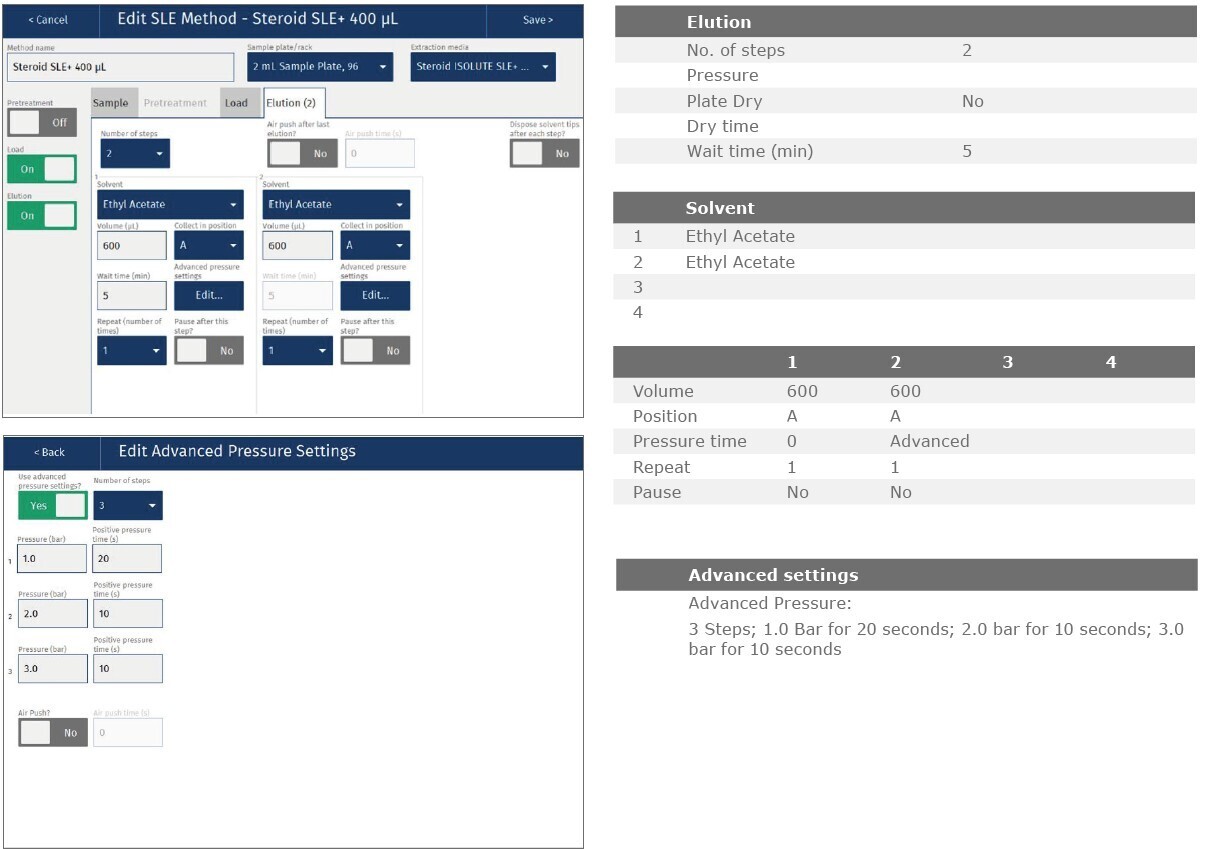
Analyte extraction
Apply an aliquot of ethyl acetate (600 µL) and allow to flow under gravity for 5 minutes. Apply a further aliquot of ethyl acetate (600 µL) and allow to flow under gravity for
5 minutes. Apply a pulse of positive pressure at 10 psi (10–20 seconds) to remove any remaining extraction solvent. Collect extracts in a 2 mL collection plate (p/n 121-5203).
Post elution and reconstitution
Evaporate the extracts to dryness under a stream of nitrogen at 40 oC for 30 mins at a flow rate of 20–40L/min using a Biotage® SPE Dry 96. Reconstitute extracts in a mix of mobile phase A/mobile phase B (50:50, v/v, 200 µL) and vortex mix. Cover plate with a sealing mat prior to injection.
UHPLC conditions
Instrument
Shimadzu Nexera X2 UHPLC
Column
ACE C18 (100 mm x 2.1 mm, 1.7 µm) (Advanced Chromatography Technologies Ltd, Aberdeen, UK) with EXP Guard column holder fitted with a C-18 cartridge (Restek, UK)
Mobile phase
A: 0.2 mM Ammonium Fluoride (aq)
B: Methanol
Flow rate
0.4 mL/min
Column temperature
40 °C
Injection volume
5 µL
Table 1. UHPLC gradient.
|
Time (min) |
%A |
%B |
|
0 |
50 |
50 |
|
2 |
50 |
50 |
|
5 |
40 |
60 |
|
8 |
10 |
90 |
|
9 |
5 |
95 |
|
9.1 |
5 |
95 |
|
9.2 |
50 |
50 |
MS conditions
Instrument
Shimadzu 8060 Triple Quadrupole MS using ES interface
Nebulizing gas flow
3 L/min
Drying gas flow
3 L/min
Heating gas flow
17 L/min
Interface temperature
400 °C
DL temperature
250 °C
Heat block temperature
400 °C
Interface temperature
400 °C
CID gas flow
270 kPa
For optimum sensitivity, data was acquired in both positive and negative ion modes, as appropriate, shown in Table 2.
Table 2. MS conditions for target analytes in positive and negative mode.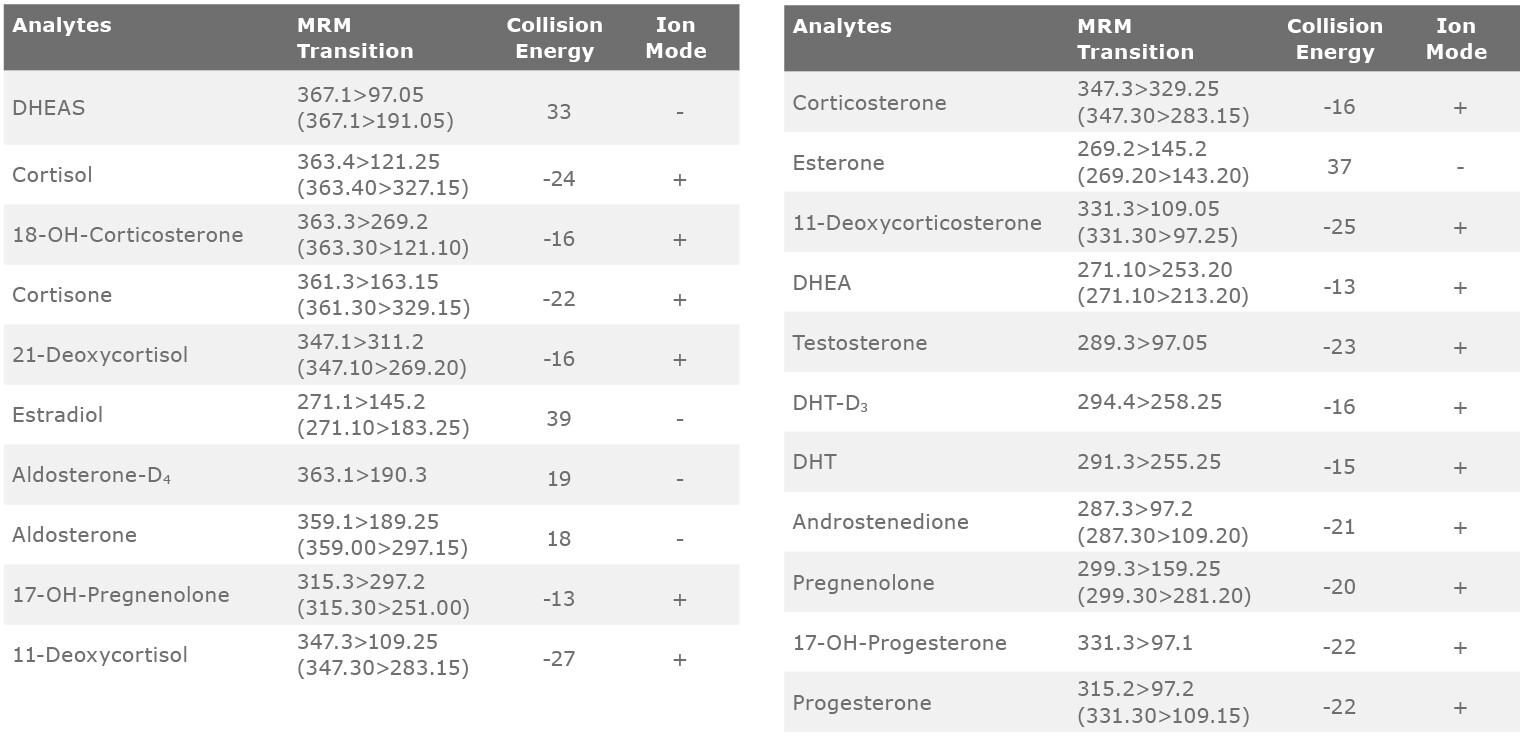
Results
 Figure 2. Typical analyte % extraction recoveries (n=7) loading 400 µL or 300 µL urine.
This simple sample preparation method delivers clean extracts and analyte recoveries mostly greater than 90% with RSDs lower than 10% for all analytes (see fig 2), and LLOQs below 10pg/mL for most of the steroids. Figure 2. below shows recoveries using 400 µL capacity ISOLUTE SLE+ plates loading either 400 µL or 300 µL sample volumes.
Figure 3. illustrates representative chromatography obtained from stripped urine spiked at 5 ng/mL. Satisfactory resolution of the various isobars was obtained using the ACE C18 UHPLC column. In order to achieve low level detection of analytes in positive and negative ion modes a combination of 0.2 mM NH4F (aq) and MeOH was utilized in the mobile phase. Figure 3. Representative chromatography for analytes spiked at a concentration of 5 ng/mL in stripped urine.
Calibration curve performance was investigated from stripped urine spiked in the range 1–1000 pg/mL. Good linearity was observed for all analytes typically delivering r2 values greater than 0.999. Table 3. details linearity performance and associated LOQ for each analyte loading 400 and 300 µL of urine. Selected calibration curves loading 400 µL are demonstrated in Figure 4.
Table 3. Analyte calibration curve r2 and LOQ performance (manual processing).
|
Analyte |
Coefficient (r²) |
Linear range, ng mL-1 |
LOQ, ng mL-1 |
% accuracy (RSD) at LOQ |
|
DHEAS |
0.9991 |
50 |
0.9991 |
50 |
|
Cortisol |
0.9994 |
< 5 |
0.9993 |
< 5 |
|
18-OH-Corticosterone |
0.9991 |
< 5 |
0.9992 |
< 5 |
|
Cortisone |
0.9993 |
< 10 |
0.9991 |
< 10 |
|
21-Deoxycortisol |
0.9998 |
5 |
0.9997 |
5 |
|
Estradiol |
0.9995 |
10 |
0.9996 |
10 |
|
Aldosterone |
0.999 |
100 |
0.9993 |
100 |
|
17-OH-Pregnenolone |
0.9993 |
< 250 |
0.999 |
100 |
|
11-Deoxycortisol |
0.9993 |
1 |
0.9995 |
< 1 |
|
Corticosterone |
0.9998 |
< 1 |
0.9997 |
< 1 |
|
Estrone |
0.9993 |
< 5 |
0.9991 |
1 |
|
11-Deoxycorticosterone |
0.999 |
< 5 |
0.9994 |
< 5 |
|
DHEA |
0.9994 |
50 |
0.9996 |
50 |
|
Testosterone |
0.9994 |
5 |
0.9993 |
< 5 |
|
DHT |
0.9991 |
< 10 |
0.9995 |
< 5 |
|
Androstenedione |
0.9993 |
5 |
0.999 |
5 |
|
Pregnenolone |
0.9993 |
< 100 |
0.999 |
< 100 |
|
17-OH-Progesterone |
0.9993 |
5 |
0.9993 |
< 10 |
|
Progesterone |
0.9991 |
< 50 |
0.9992 |
< 50 |
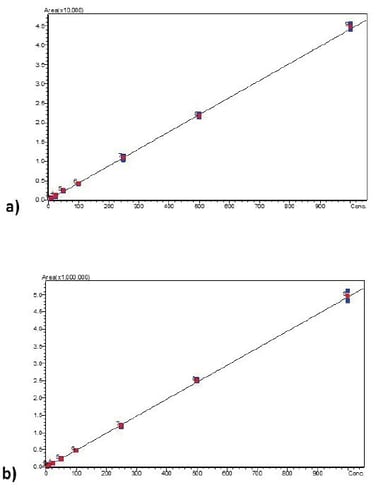
 Figure 4. Calibration curves for Estradiol (a), Testosterone (b), 17-OH-Progesterone (c) and Androstenedione (d).
Chemicals and reagents
- Methanol (LC-MS grade), Ultra-Pure Methanol (Gradient MS) and ethyl acetate were purchased from Honeywell Research Chemicals (Bucharest, Romania).
- All analyte standards, deuterated internal standards and ammonium fluoride were purchased from Sigma- Aldrich Company Ltd. (Gillingham, UK).
- Water (18.2 MΩ.cm) was drawn fresh daily from a Direct-Q5 water purifier (Merck Millipore, Watford, UK).
- Mobile phase A (0.2 mM ammonium fluoride (aq)) was prepared by adding 7.4 mg of ammonium fluoride to 1 L purified water.
- Internal standards (100 pg/µL) were prepared from a 10 ng/µL stock solution by adding 10 µL of each to 950 µL of MeOH. 10 µL of this solution was then added to each calibration sample.
- Reconstitution solvent was made by mixing 50 mL of mobile A and 50 mL of mobile phase B
Additional information
- All data shown in this application note was generated using fresh urine provided by healthy human volunteers.
- Ammonium fluoride increased sensitivity in both positive and negative ion modes.
- Other strategies for increasing sensitivity:
- Decrease reconstitution solvent volume below 200 µL
- Increase injection volumes above 10 µL.
- Steroids can exhibit non-specific binding to plastic collection plates. Different plastics exhibit different binding characteristics. Addition of 2 μL of ethylene glycol to the collection plate prior to evaporation can mitigate this issue. Note: No ethylene glycol was used in generation of the data shown in this application note, utilizing collection plate p/n 121-5203.
Ordering information
|
Part Number |
Description |
Quantity |
|
820-0400-P01 |
ISOLUTE® SLE+ 400 µL Capacity Plate |
1 |
|
PPM-96 |
Biotage® PRESSURE+ 96 Positive Pressure Manifold |
1 |
|
SD-9600-DHS-EU |
Biotage® SPE Dry 96 Sample Evaporator 220/240 V |
1 |
|
SD-9600-DHS-NA |
Biotage® SPE Dry 96 Sample Evaporator 100/120 V |
1 |
|
121-5203 |
Collection Plate, 2 mL Square |
50 |
|
121-5204 |
Pierceable Sealing Mat |
50 |
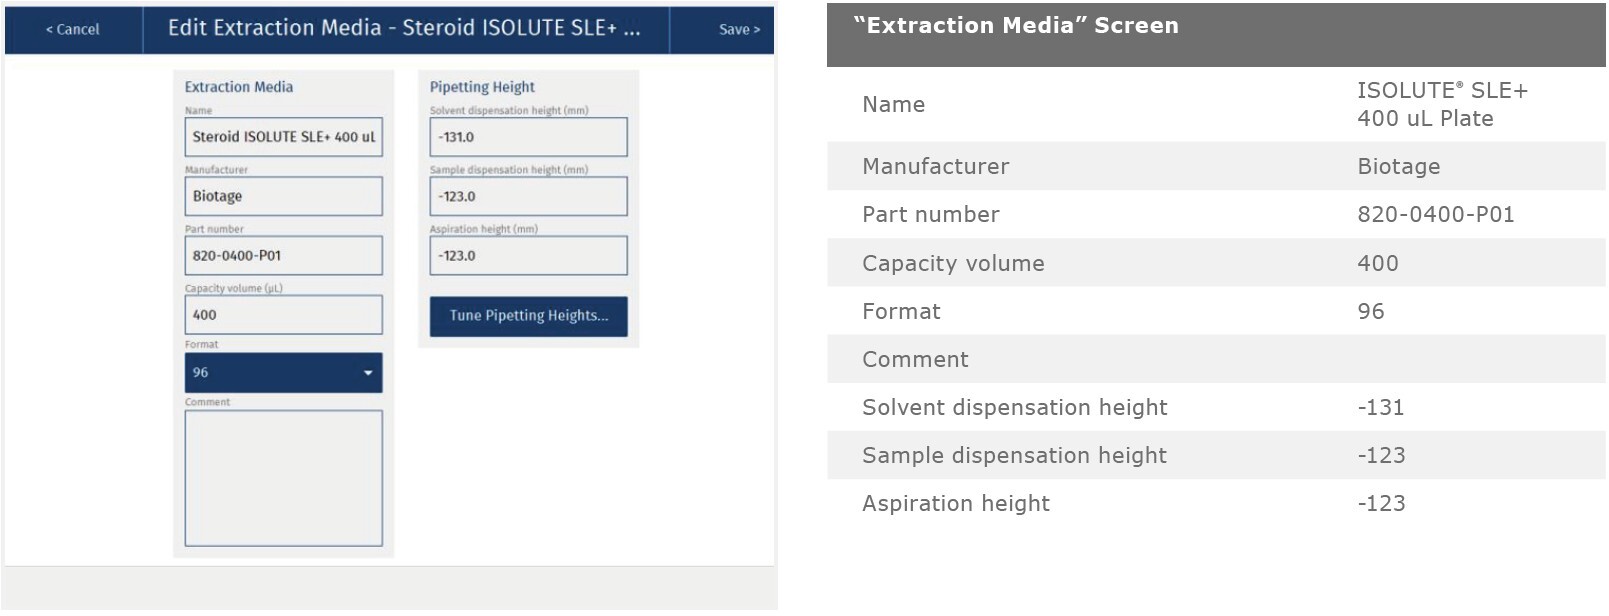
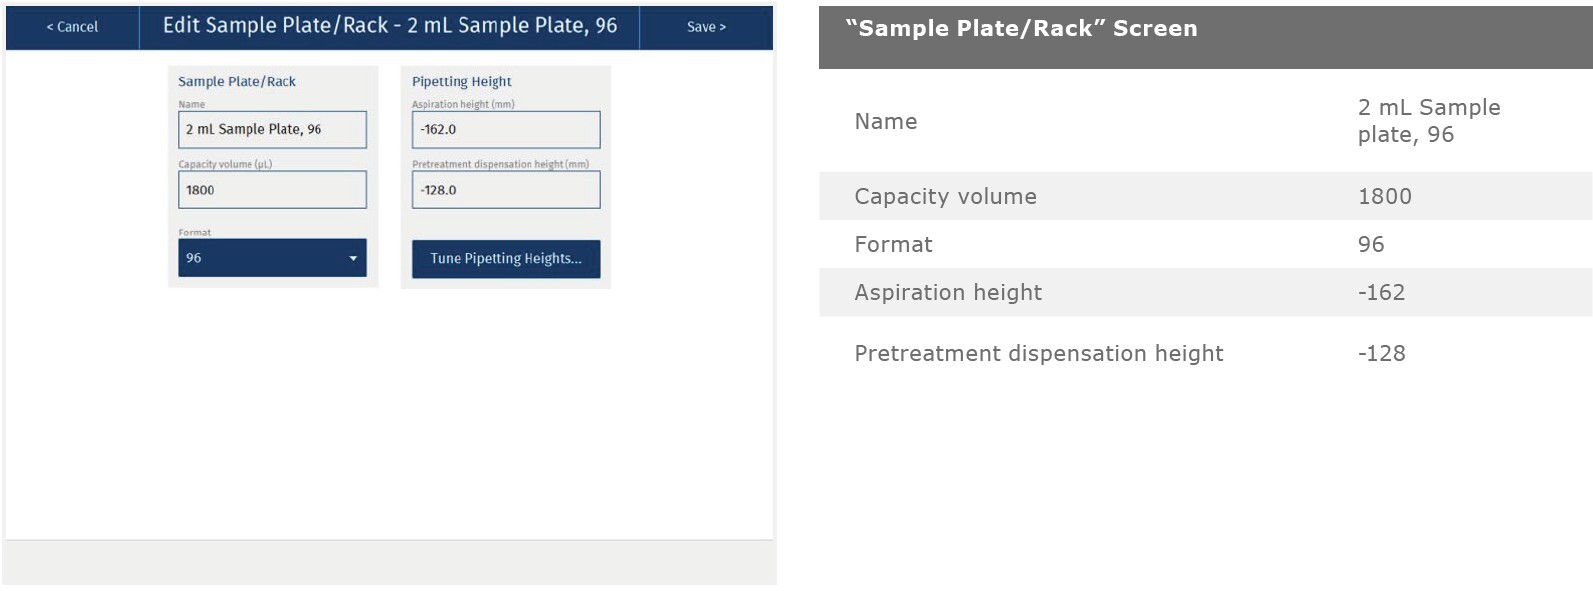
Appendix: Biotage® ExtraheraTM settings
The method described in this application note was automated using Biotage® Extrahera™ and ISOLUTE® SLE+ plates. This appendix contains the software settings required to configure Extrahera to run this method.
Comparable results were obtained using both manual and automated processing methods.
|
Sample Name: |
Urinary Steroids - SLE+ |
|
Sample Plate/Rack: |
Plate |
|
Extraction Media: |
400 µL ISOLUTE® SLE+ |
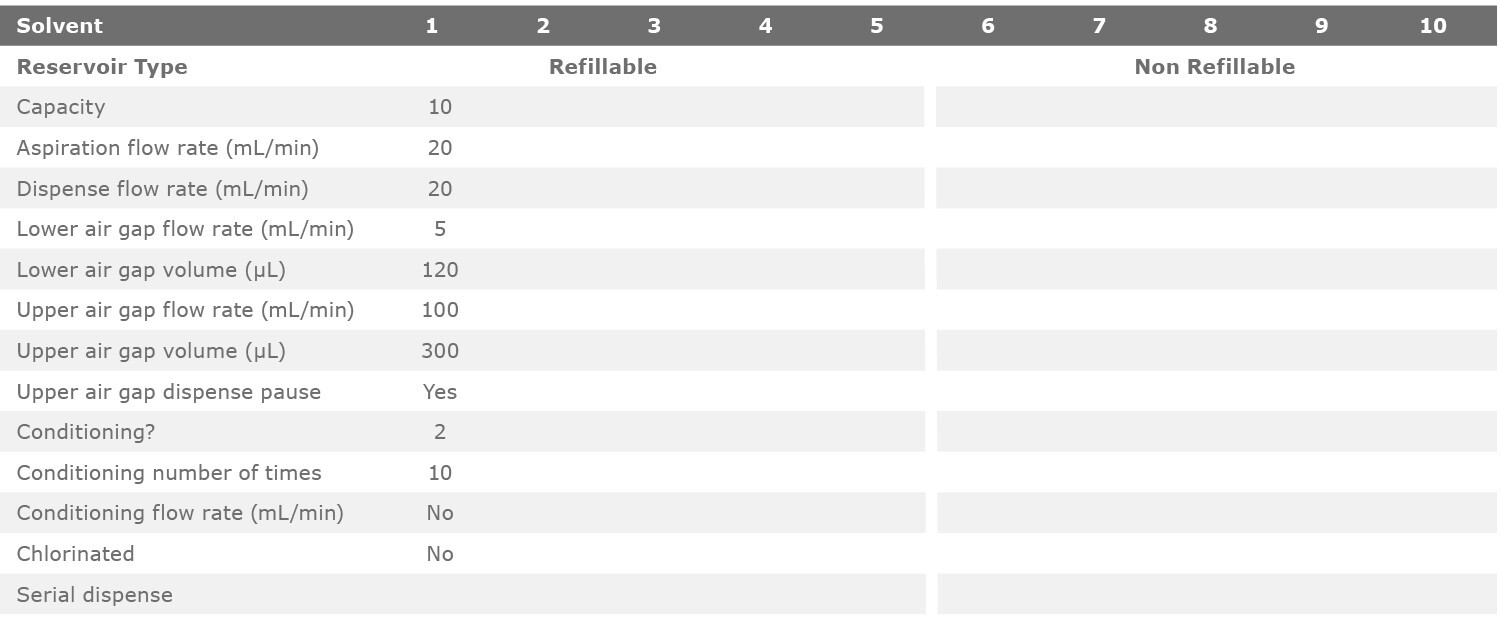
Settings
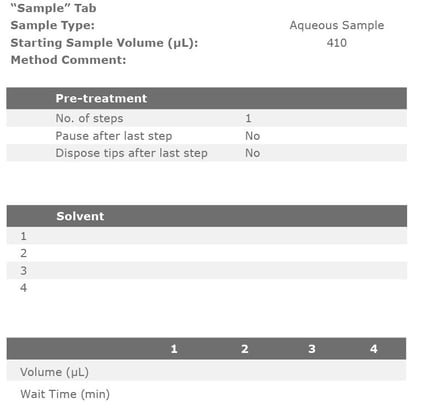
Solvent properties
|
Solvent Description |
|
|
1 |
Ethyl Acetate |
Results
Using the method parameters described in this appendix, analyte recoveries, %RSDs, linearities and LOQs were comparable for both manually processed and automated methods.
A comparison of analyte recoveries with RSDs obtained through manual and automated processing are shown in figure 5 (400 µL sample load) and 7 (300 µL sample load).
Table 4 shows linearity and LOQ data for the automated processing method. Figure 5. Comparison of steroid recovery and RSD for 400 µL sample load.
 Figure 6. Comparison of steroid recovery and RSD for 300 µL sample load.
Table 4. Analyte calibration curve r2 and LOQ performance (automated processing).
|
Analytes |
r2 400 µL Load |
LLOQ (pg/mL) 400 µL Load |
r2 300 µL Load |
LLOQ (pg/mL) 300 µL Load |
|
DHEAS |
0.9991 |
100 |
0.9991 |
<100 |
|
Cortisol |
0.9992 |
<5 |
0.9992 |
5 |
|
18-OH-Corticosterone |
0.9995 |
<10 |
0.9990 |
<25 |
|
Cortisone |
0.9995 |
<10 |
0.9995 |
<10 |
|
21-Deoxycortisol |
0.9998 |
<5 |
0.9997 |
<5 |
|
Estradiol |
0.9990 |
10 |
0.9990 |
25 |
|
Aldosterone |
0.9994 |
100 |
0.9994 |
100 |
|
17-OH-Pregnenolone |
0.9991 |
<250 |
0.999 |
100 |
|
11-Deoxycortisol |
0.9994 |
<5 |
0.9991 |
<5 |
|
Corticosterone |
0.9993 |
<5 |
0.9993 |
10 |
|
Estrone |
0.9996 |
<5 |
0.9991 |
1 |
|
11-Deoxycorticosterone |
0.9992 |
<5 |
0.9994 |
10 |
|
DHEA |
0.9996 |
100 |
0.9996 |
50 |
|
Testosterone |
0.9992 |
<10 |
0.9993 |
10 |
|
DHT |
0.9995 |
<25 |
0.9995 |
25 |
|
Androstenedione |
0.9995 |
<10 |
0.9990 |
10 |
|
Pregnenolone |
0.9996 |
100 |
0.999 |
100 |
|
17-OH-Progesterone |
0.9991 |
5 |
0.9993 |
<10 |
|
Progesterone |
0.9990 |
25 |
0.9992 |
<50 |
Literature Number: AN923
