Introduction
Discovering new chemical entities (NCEs) or new molecular entities (NMEs) is costly and time consuming. One needs only to look at the top 15 global pharmaceutical companies to see how expensive this process is, Table 1. These major pharma- ceutical companies spend between 16% and 24% of their annual sales on R&D but average less than 1 new drug per year between them. Of the top 15 companies shown, the productivity efficiency is no less than $3 billion per approved drug1.
A major contributor to the long timelines and high research costs are the bottlenecks encountered during the discovery process. One of the larger bottlenecks is compound purification, usually performed by flash chromatography.
Like the majority of corporate investors, those who are helping fund these research companies like a good, quick return on their investment so any improvements to increase research productivity is beneficial.
|
|
2008–2017 sales ($B)¹ |
2008–2017 R&D ($B)¹ |
R&D spend as a % of sales |
NME+ BLA² |
Efficiency ($/approval) |
|
Pfizer |
$477,096 |
$77,868 |
16% |
7 |
$11,124 |
|
Novartis |
$433,854 |
$81,404 |
19% |
13 |
$6,262 |
|
Sanofi |
$375,757 |
$62,376 |
17% |
7 |
$8,911 |
|
Roche |
$369,386 |
$83,534 |
23% |
2 |
$41,767 |
|
Merck |
$351,330 |
$75,614 |
22% |
8 |
$9,452 |
|
GSK |
$330,438 |
$52,854 |
16% |
11 |
$4,805 |
|
Astra Zeneca |
$272,597 |
$50,927 |
19% |
8 |
$6,366 |
|
J&J |
$270,205 |
$56,436 |
21% |
10 |
$5,644 |
|
Lilly |
$189,154 |
$45,441 |
24% |
7 |
$6,492 |
|
Amgen |
$177,887 |
$34,462 |
19% |
5 |
$6,892 |
|
BMS |
$165,531 |
$36,246 |
22% |
7 |
$5,178 |
|
Teva |
$164,492 |
$16,403 |
10% |
2 |
$8,202 |
|
Gilead |
$162,585 |
$22,361 |
14% |
7 |
$3,194 |
|
Bayer |
$153,498 |
$24,645 |
16% |
7 |
$3,521 |
|
Takeda |
$137,199 |
$33,040 |
24% |
5 |
$6,608 |
Table 1. Top 15 pharmaceutical companies R&D efficiency 1,2
Pharma drug discovery and development process
The process followed by pharmaceutical R&D companies is multifaceted beginning with determining a target disease, making and screening compounds (HTS or high-throughput screening), identifying a “hit” compound or compounds (HIT ID), testing the hits and converting those deemed suitable to “leads” (H2L), followed by optimizing the lead’s synthesis (LO), Figure 1.
Once optimized, the molecular synthesis is passed to scale up labs in order to make clinical quantities to evaluate efficacy, toxicity, bioavailability, etc., and enters clinical trials. The typical time to move a project from HTS to the clinic is 3-6 years followed by another 6-7 years for clinical trials – all at a cost of roughly $1 billion. However, as you have seen in the table above, these costs can be significantly higher. Figure 1. Drug discovery process, timeline, and typical costs3.
The early stages when compounds are being screened, hits identified and converted to leads to be optimized, there is significant synthetic research conducted including all of the intermediate compounds. After its synthesis, the intermediate product needs purification, typically using flash chromatography. The purified intermediate is then reacted with other reagents to make the next intermediate on the road to the final target molecule, Figure 2. Depending on the final compound’s synthetic complexity, the complete synthesis could take weeks to finish. This is where efficiency improvements affect productivity with the ultimate goal of reducing the time between creating an idea for a new synthetic pathway and having a compound ready for biological testing. Figure 2. Drug discovery and optimization is a long, iterative process requiring flash purification after almost every synthetic step.
This is a worthy goal, but there is an important question that need answering - How can we speed up drug discovery research and decrease costs without reducing product quality?
This is not an easy question to answer since the three goals influence each other, Figure 3. Which of these important goals can be compromised for the sake of the other two?
Quality is the ultimate priority and cannot be sacrificed, so that leaves speed and cost. To speed drug discovery research, more people and/or tools are added, which increases costs. Likewise, if discovery is performed a minimal cost then progress is slowed. Quite the challenge.
Added to this optimization conundrum is the fact that today’s disease targets often require highly complex and sometimes more polar molecules then in the past. These unique molecules are typically more difficult to synthesize, increasing both cost and timeline. Figure 3. Optimizing product quality and development speed while cutting costs is a major challenge faced by all companies.
Overcoming optimization challenges
Through synthetic innovation such as microwave-assisted organic synthesis (MAOS), experimenting with different reaction conditions is quick – often 5 to 15 minutes per reaction. After synthesis, reaction mixtures are purified, typically using flash chromatography, which itself has the ability to be fast and inexpensive with the right tools and knowledge. Final compound purification, however, is normally accomplished using reversed-phase preparative HPLC (RP prep-HPLC).
The RP prep-HPLC step is often performed by another chemist either in an independent, internal analytical lab or prep lab . Either way, the synthesis chemist hands over the result of what may be weeks of synthesis to a person or group to perform the final purification and evaluation. This adds to the project cost as the project is charged for this lab’s time and facilities while increasing the project timeline as the synthetic chemist waits for the results and the return of the purified material.
So this situation raises the question – can reversed-phase flash purification replace RP prep-HPLC?
Synthesis chemists are very familiar with normal-phase flash chromatography but less familiar with reversed-phase. While normal-phase chromatography utilizes organic solvents, reversed-phase chromatography uses water and a water miscible solvent such as methanol or acetonitrile. So, to perform reversed-phase on the same flash system requires a solvent conversion. Not a difficult process but requires some thought, and a bit of time. The common alternative to solvent switching entails dedicating a flash system solely for reversed- phase purification which adds to the project expense.
Then there is the question of separation efficiency. Can reversed-phase flash columns perform as well as RP prep-HPLC columns? With the advent of high performance flash columns, this is often possible.
Altering the purification paradigm
Chemists tend to be creatures of habit in regards to purifica- tion. Purification is simply part of the synthesis process and is accomplished using a column packed with silica and two solvents, either hexane or heptane with ethyl acetate, or dichloromethane with methanol for polar compounds. The elution gradients tend to be simple and linear with sample loading based on the 1% rule.
Today’s automated flash systems are designed to purify a chemist’s sample to free-up time but are often modified on-the- fly by the chemist during purification. Chemists do this because they have not optimized the method and are not sure where their synthesized compound will elute and how well it will be separated from the reaction by-products.
Also not optimized is the sample load. The 1% rule, commonly practiced, says to use a column containing 100 times more silica than the amount of reaction mix needing purification. For example, a 100 mg reaction mixture requires a 10-gram silica column and a 1-gram reaction requires a 100-gram column. When the purification is difficult, following this rule leads to a low purity product and re-purification, which is inefficient and wasteful. When the separation is easy, following this rule leads to greater solvent consumption and longer purification times, also inefficient.
No more guessing
Tools are available on some modern flash chromatography systems which eliminate the guesswork and its inefficiencies. One of the tools is automated method development using thin-layer chromatography (TLC). With TLC, various solvents and blends can be scouted to find the best separation conditions. When done in parallel, this is an efficient process requiring minimal solvent and time. Good TLC data directly translates to good gradient elution methods with predictable sample loads, eliminating flash purification uncertainty.
TLC-based linear gradients
Flash chromatography systems such as the Biotage® Selekt convert TLC data into a linear gradient. The chemist simply enters a value corresponding to the percentage of strong solvent used with the TLC and while adjusts the positions of the target compound (product) and its two nearest eluting neighbors, one above it and one below it, on the system’s touchscreen, Figure 4. Figure 4. Automated TLC to linear gradient method based on the solvent % and three compounds’ migration distances (Rf) including the target product (green) and its two closest neighbors (blue and red).
Besides creating a linear gradient, the Biotage® Selekt system will also provide guidance regarding an appropriate column size for the amount of crude mix requiring purification, Figure 5. Figure 5. The TLC information provided generates a linear gradient that elutes all compounds with a Rf > 0.1 and provides a list of columns capable of performing the separation.
These advanced features eliminate the inefficient guesswork mentioned earlier.
Using the suggested method, column, and load amount ensures purification success, Figure 6. Figure 6. Purification results using a TLC-based method and column selection (10 gram SNAP KP-Sil).
TLC-based step gradients
An even more efficient way to create reliable purification methods (and further reduce time and cost) is to use data from two TLC plates. Data from two TLC plates enables the system to create a step gradient. Step gradients typically shorten the purification time and increase loading capacity, Figure 7.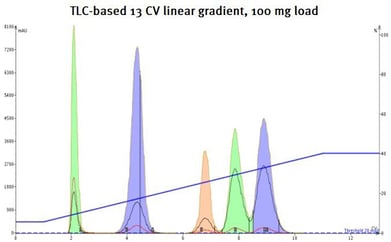
 Figure 7. The TLC-based step gradient increased loading by 2x while reducing solvent use 15%.
These techniques alone provide improved efficiencies in drug discovery by eliminating guesswork and re-purifications that waste time and money. However, even more can be done to further improve productivity.
Advanced column technology
Smart, automated systems are one-half of the solution, as seen above. The other half is advanced, high-performance flash columns and media.
The most popular flash chromatography media is granular silica with a particle size of 40–63 µm, a pore diameter of 60 Å and a surface area of ~ 500 m2/g. This silica is made by grinding large, millimeter-sized synthetic silica and then sieving it to the specific particle size range. While this silica works for many applications, it often fails to provide the purity and throughput levels needed when purifying complex reaction mixtures and can liberate micro particulates that contaminate collected fractions.
Modern silica is spherical and manufactured with equipment capable of synthesizing the media with a specific particle diameter range (microns rather than millimeters), porosity, and surface area. Silica made this way has increased stability and consistency.
For reversed-phase flash purification, C18 bonded 25 µm silica is now commonplace and commonly used to purify reaction mixtures with ionizable functionality.
Along with new, high performance silica have come higher performance columns. These columns, called Biotage® Sfär, have been designed to tolerate higher operating pressures (as high as 17 bar) often generated by high performance C18 media.
Increasing surface area, decreasing particle size
Since modern silica synthesis methods are more easily controlled, they can be adjusted to create application-specific media. For flash chromatography, the application needs are high loading capacity and improved separations. Increasing silica’s surface area addresses the loading capacity applica- tion while decreasing particle size increases separation performance. Combined, this high surface, small particle silica improves purification performance while reducing the amount of silica and solvent required for purification.
This fact is presented in the example below where a mixture of butyl and methyl paraben (100 mg) is purified using three different silica media, Figure 8.
- A typical, granular silica (40-63 um, 60Å, 500 m2/g).
- A synthetic, high surface area (60 µm, ~750 m2/g, 50Å) silica.
- A synthetic, high surface area (20 µm, ~750 m2/g, 50Å) silica with a linear gradient.
 Figure 8. Purification comparison of granular, 40-63 um silica (top) with spherical, high surface area silica with 60 um (middle) and 20 um (bottom) particles. The smaller particle, high surface are media provides the same purification results but requires a column with 1/2 of the silica.
From this data it is clear that the spherical, high surface area silica improves peak shape, sharpens the elution bands, and improves the overall separation. Additionally, when particle size is reduced and surface area increased, an equivalent purifica- tion is possible with a column containing half the silica amount. In this example, a 5-gram column packed with high surface area, 20 µm silica provides the same purification results for the same load as the 10-gram columns packed with larger particle silica but uses less solvent and time.
The extent of the productivity improvements is quantified in Table 2. The table compares purification time and solvent consumption of the three columns above. Because the 40-63 µm silica is packed in a different column housing with lower pressure tolerance, the equilibration flow rate used (36 mL/min) was less than those using the Biotage Sfär design (150 mL/min). The lower flow rate then required more solvent to fully equilibrate.
The result is that using the Biotage Sfär column containing higher surface area silica reduces purification time and solvent consumption when compared to the 40-63 µm column. More specifically, the 20 µm, 5-gram column reduces purification time 22% and cuts solvent use 44%.
|
Parameter |
10 g 40-63 µm |
10 g 60 µm |
5 g 20 µm |
|
Column volume (mL) |
15 |
15 |
9 |
|
Equilibration flow rate (mL/min) |
36 |
150 |
150 |
|
Equilibration length (CV) |
3 |
2 |
2 |
|
Equilibration volume (mL) |
45 |
30 |
18 |
|
Equilibration time (min) |
1.25 |
0.2 |
0.1 |
|
Run flow rate (mL/min)* |
27 |
29 |
18 |
|
13 CV gradient run volume (mL) |
195 |
195 |
117 |
|
13 CV gradient run time (min) |
7.2 |
6.7 |
6.5 |
|
Total method volume (mL) (equil + gradient) |
240 |
225 |
135 |
|
Total method time (min) (equil + gradient) |
8.45 |
6.9 |
6.6 |
|
Total solvent savings (%) |
|
6 |
44 |
|
Total time savings (%) |
|
18 |
22 |
Table 2. A comparison of time and solvent consumption between three different silica columns.
Maximizing productivity
Further productivity enhancements are realized using a step gradient. As previously mentioned, step gradients can reduce the purification method time and solvent need without sacrificing product purity.
This is highlighted when the 5-gram column in the previous example is used with a step gradient to purify the same sample at the same load, Figure 9.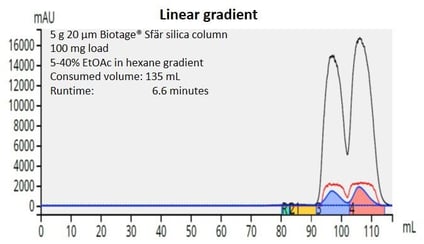
 Figure 9. Comparison of linear gradient and step gradient purification of a mixture of parabens. The step gradient performs the purification to the same performance level but with less solvent and less time.
The step gradient reduces solvent use another 37% and is 42% faster than the linear gradient. When compared to the granular silica column, the savings are even greater — 65% solvent savings and a 55% time reduction, Table 3.
|
Parameter |
10 g 40-63 µm Linear gradient |
10 g 60 µm Linear gradient |
5 g 20 µm Linear gradient |
5 g 20 µm Step gradient |
|
Column volume (mL) |
15 |
15 |
9 |
9 |
|
Equilibration flow rate (mL/min) |
36 |
150 |
150 |
150 |
|
Equilibration length (CV) |
3 |
2 |
2 |
2 |
|
Equilibration volume (mL) |
45 |
30 |
18 |
18 |
|
Equilibration time (min) |
1.25 |
0.2 |
0.1 |
0.1 |
|
Run flow rate (mL/min)* |
27 |
29 |
18 |
18 |
|
Gradient run volume (mL) |
195 |
195 |
117 |
67 |
|
Gradient run time (min) |
7.2 |
7.3 |
6.5 |
3.7 |
|
Total method volume(mL) (equil + gradient) |
240 |
225 |
135 |
85 |
|
Total method time (min) (equil + gradient) |
8.45 |
6.9 |
6.6 |
3.8 |
|
Total solvent savings vs. 40-63 µm column (%) |
|
6 |
44 |
65 |
|
Total time savings vs. 40-63 µm column (%) |
|
18 |
22 |
55 |
Table 3. Time and solvent need comparison between granular silica and spherical silica columns run with linear and step gradients.
Incorporating reversed-phase into drug discovery
Reversed-phase purification for medicinal chemists is either a shunned technique or a task done by another group within the company. There are valid concerns with reversed-phase flash purification including flash system contamination from polar solvents and the compounds being purified, to water removal, and elevated operating pressures generated by the viscous water-based mobile phases. However, with many NMEs being polar, reversed-phase purification, even with intermediates, is becoming more necessary in the drug discovery lab.
As mentioned previously, when medicinal chemists in a drug discovery lab need to perform reversed-phase flash chromatography, they either have a different group to do this with prep-HPLC or use a dedicated reversed-phase flash system in their lab. The latter is becoming more popular these days but having a dedicated reversed-phase flash system adds expense to the project.
A solution to these issues is a flash system capable of automatically switching from normal-phase solvents to reversed-phase solvents (and back when needed) which can tolerate elevated operating pressures. These capabilities, standard features of the Biotage® Selekt flash system, eliminate concerns with solvent and chemical contamination and over-pressure.
The Biotage Selekt system can withstand 30 bar (425 psi) while pumping solvent as high as 300 mL/min. These capabilities enable chemists to not only perform small-scale purification but do scale-up as well, even with small particle reversed-phase flash columns.
As with the small particle silica columns mentioned previously, small particle reversed-phase columns provide better separations which, in turn, provide higher product purity. Sometimes, reversed phase is the better choice for purification, Figure 10. Figure 10. Comparison of normal- and reversed-phase purification methods. On the left is the normal-phase step gradient purification of a 100 mg load butyl paraben and methyl paraben. On the right is the reversed-phase purification of the same load of paraben mix. In this example, reversed-phase is a better purification option.
High performance reversed-phase columns, such as the Biotage® Sfär C18, provide excellent purification of simple and complex mixtures alike, Figure 11. Figure 11. Reversed-phase flash purification of a complex reaction mixture containing more than 15 compounds.
Reversed-phase flash chromatography has shown to outperform HPLC in many cases, Figure 12. The same gradient (55%-90% methanol/water) was used on both columns for the separations. Each gradient segment was the same duration and flow linear velocities were similar but the results are better with the flash column as indicated by the improved separation of the third and fourth eluting peaks. In addition to the better separation, the flash column required only 11 minutes to purify the sample vs. 28 minutes by HPLC, a 17-minute timesaving.
 Figure 12. Comparison of RP-HPLC (left) and RP flash chromatography (right) using identical gradient methods. The Biotage® Sfär C18 flash column provides an excellent purification of all compounds while the C18 HPLC column is unable to fully resolve the third and fourth eluting peaks. As an added benefit, the flash column, operated at 25 mL/min, purifies the sample in 11 minutes compared to 28 minute for the HPLC run.
Productivity improvement achieved
Using the strategies presented herein, we have demonstrated that modern flash chromatography instrumentation and columns provide chemists the capability to improve drug discovery productivity by reducing the time and cost of reaction mixture purification without sacrificing quality.
Depending on the purification need, modern flash systems, methodology, and columns can produce savings >50% in both solvent and time. These productivity improvements then positively impact the later aspects of drug development pathway.
References
- Pharmaceutical Executive magazine, Top 50 Pharma issues from 2009–2018
- www.FDA.com, CDER new molecular entity (NME) and biological license application (BLA) data 2008–2017
- Internal communication.
Literature Number: PPS506
