Feb 6, 2023 10:07:01 AM
By Elizabeth Denton

We all use mobile phase modifiers, regardless of purification strategy, for purification of our synthetic peptides. With ionizable side chains, something that affects the pH of the mobile phase is a must to ensure that the desired peptide (and any impurities) elute from the column in a single, well defined peak. While a 0.1% modifier concentration is basically standard these days (sometimes you'll see different), I started to wonder if this was really enough modifier to fully protonate all possible side chains when using flash chromatography to purify peptides. In today's post I'll look into the effects of different mobile phase modifier concentrations with respect to general peak shape and final sample purity.
One of the biggest advantages for using reversed-phase high performance flash chromatography (RP-HPFC) in peptide purification is the significant increase in sample loading capacity. To fully reconcile this advantage, I often load a very concentrated sample (hundreds of mg in a few hundred microliters) onto the column for purification, Figure 1.
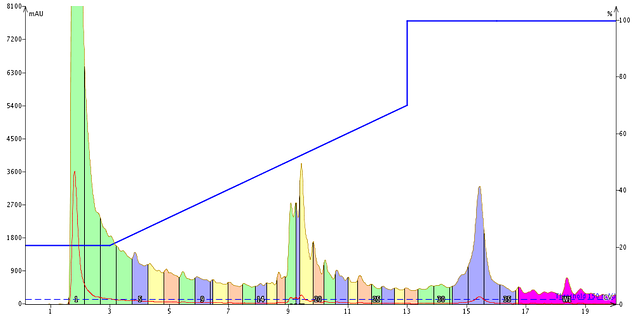
Figure 1. Purification of crude GLP-1 via HPFC using a standard, initial, gradient and 0.1% TFA as the mobile phase modifier. The purified sample contained about 40 mg of crude peptide and was loaded onto the column in a total of 300 µL DMSO. While the major peak (yellow) does in fact contain the desired peptide, it is poorly resolved from both the early eluting and late eluting impurities.
I'm always looking for new ways that can improve the purity, and simplicity of flash chromatography for peptide purification. One of the biggest concerns I often hear from new users of this technique is that the peaks are broad and it's sometimes hard to tell which peak corresponds to the compound of interest.
After some conversations with colleagues, I started thinking about what is physically going on with the peptide sample, the stationary phase, the mobile phase, and their respective relationships during a purification. I load a relatively concentrated sample (50-100 mg most of the time) onto a column that is then quickly eluted from the stationary phase with a relatively small amount of mobile phase (about 300 mL, often in 10-15 minutes). The purpose of the mobile phase modifier is to ensure that the sample being purified is in a single ionization state and I began to question whether or not the standard TFA concentration is really enough to do the job under these circumstances.
So here's some math. If I load 50 mg of GLP-1, a 37 amino acid peptide with 13 ionizable side chains, that corresponds to 11.9 µmoles of peptide, which could consume up to 13-fold more protons (154.7 μmoles). Now, a 0.1% TFA concentration corresponds to about 13 mM, seems like a lot. But over the course of an average purification - 300 mL or so - only 3.9 mmoles of TFA (protons) will flow through the column. TOTAL. That's nearly 3-fold less protons than sample loaded available to influence my chromatography. So what would happen if that ratio was closer to 1:1 or even greater?
I first developed a focused gradient with my Biotage® Isolera™ Dalton 2000 and then proceeded to purify about 40 mg of crude GLP-1 using different concentrations of TFA as the mobile phase modifier. To start with, I did the opposite of what you might normally think and purified an aliquot of GLP-1 using 0.05% TFA as the mobile phase modifier, Figure 2.
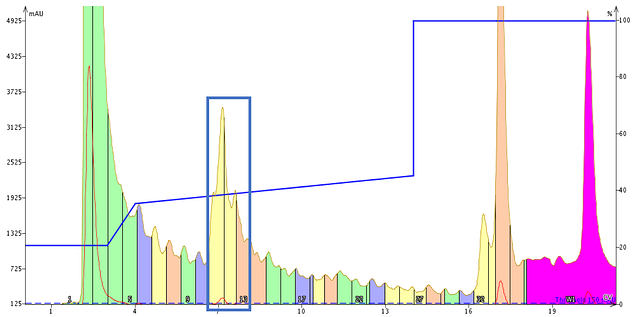
Figure 2. Purification of GLP-1 using an optimized focused gradient at 0.05% TFA as the mobile phase modifier. Fractions 11-13 (blue box) were further analyzed separately by analytical HPLC.
While the peak sharpness suggests that the purification has gone well, the analytical HPLC tells a different story, Figure 3.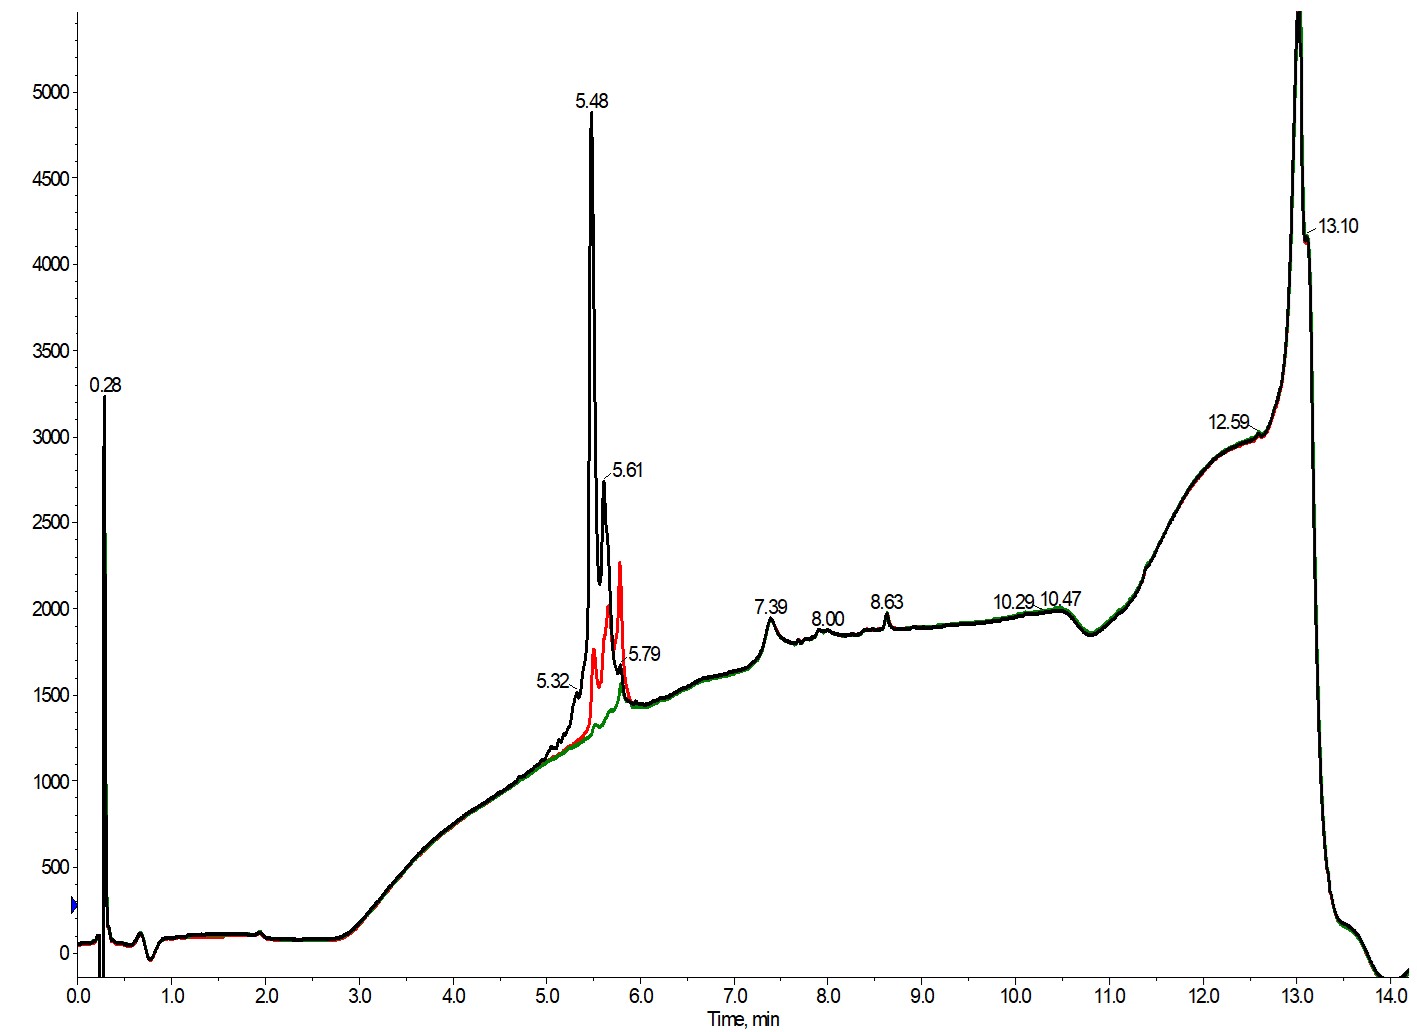
Figure 3. Overlay of the analytical chromatograms analyzing the purity of fraction 11 (black), fraction 12 (red) and fraction 13 (green).
Unfortunately, none of these three fractions is sufficiently pure to move on to assays without further HPLC polishing. That isn't surprising though given the conditions of the purification. These peaks elute very early in the chromatogram, suggesting incomplete ionization of either the acidic or basic amino acid side chains (more hydrophilic, therefore less retained) on the desired peptide and the related impurities, which in turn correlates to minimal ion pairing effects of any residual trifluoracetate counterions in the mobile phase.
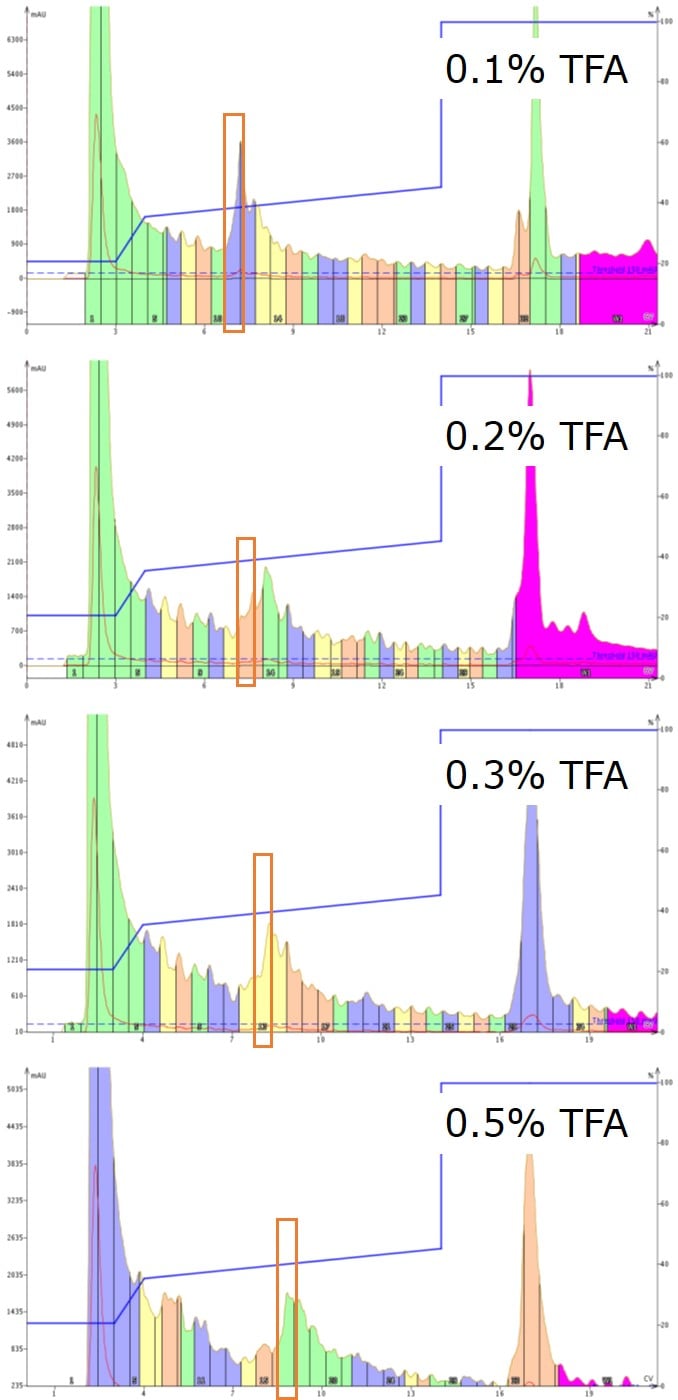
Figure 4. Purification of GLP-1 using a focused gradient and increasing concentrations of TFA as the mobile phase modifier. All fractions were kept separate for analytical HPLC purity analysis. The highest purity samples are indicated by the orange box.
I find most interesting the chromatographic evolution that occurs by simply increasing the TFA concentration in the mobile phase, Figure 4. At very low concentrations, very sharp peaks are observed which broaden as the concentration of TFA is increased. Median concentrations of TFA result in the broadest of peaks, demanding the most effort in follow up analysis. Most interestingly to me though is that at the highest concentration of TFA evaluated, the peak sharpness returns. At 0.5% TFA in the mobile phase, a total of 19.6 mmols flows through the system over the course of the purification (~300 mL), which corresponds to 127 fold excess relative to the quantity of crude material loaded and all the possible ionic side chains. Importantly, the increased compound retention that comes with increased levels of TFA also enables clearer separation of the desired compound from the neighboring impurities.
While peak clarity can help to simplify and reduce follow up analysis, the true measure of success comes with purity and recovery. After analyzing multiple fractions in each purification, I decided to highlight the analytical chromatography for only the most pure fraction (orange boxes) from each of the above purification attempts, Figure 5.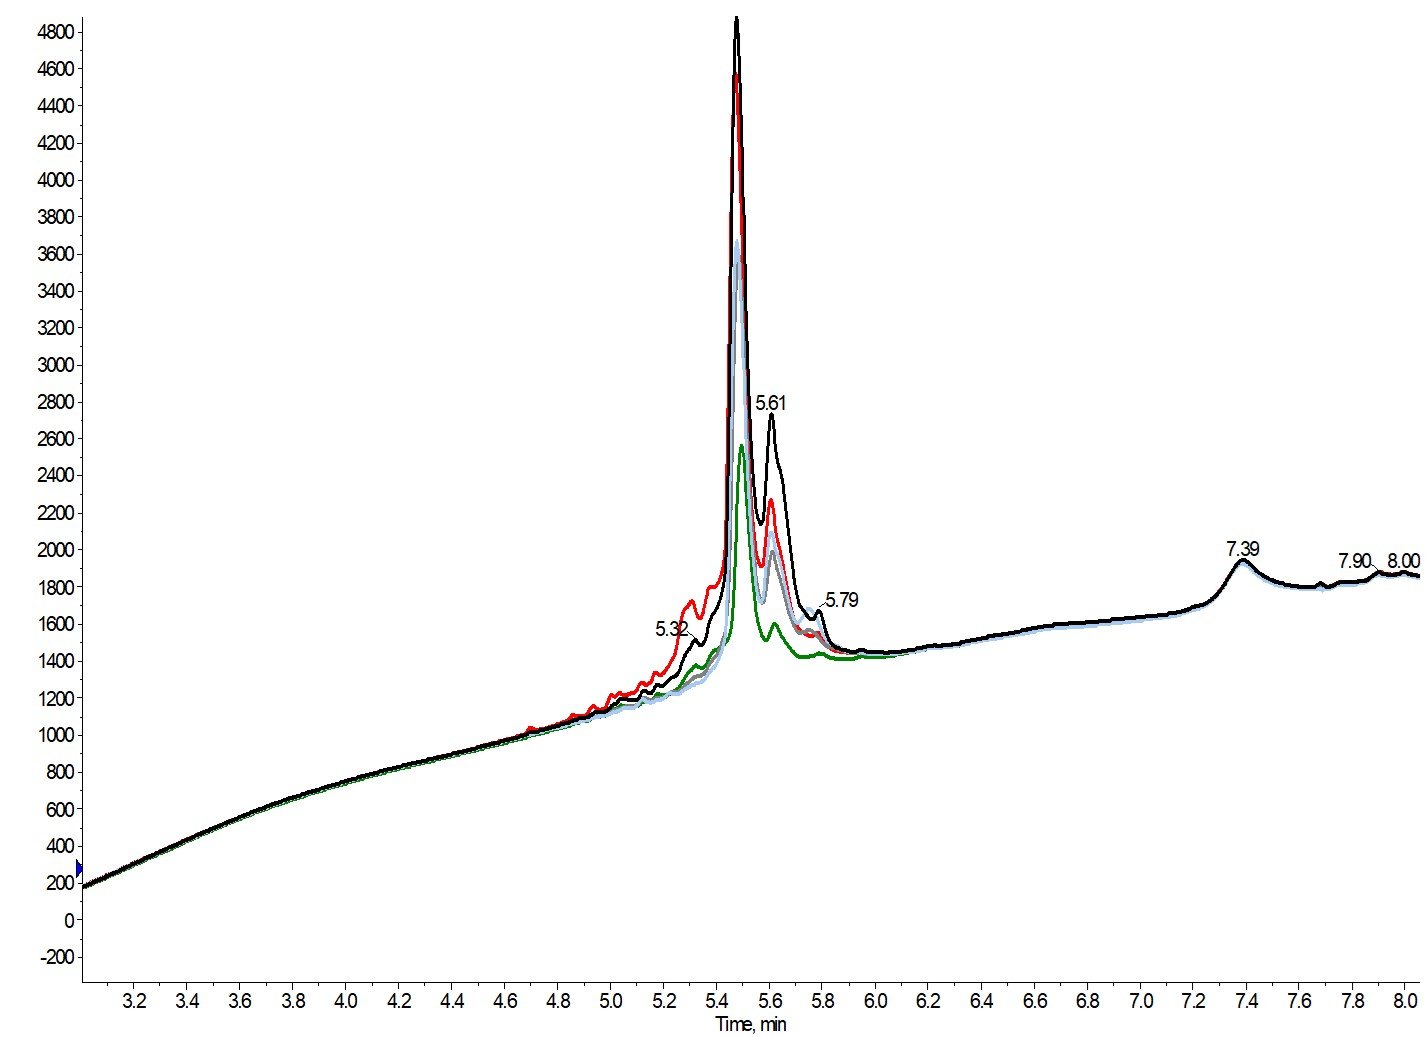
Figure 5. Analytical HPLC chromatograms (zoomed for clarity) of the most pure fraction for GLP-1 purified using 0.05% TFA (black, 64% pure), 0.1% TFA (red, 68% pure) 0.2% TFA (green, 85% pure), 0.3% TFA (grey, 67% pure) or 0.5% TFA (sky blue, 63% pure) as the mobile phase modifier.
Each of these samples was evaporated, dissolved, and diluted identically prior to the analytical purity quantification, enabling us to glean some relative recovery information as well. Interestingly, the purification that, in my mind, was least successful (0.05% TFA) enabled the highest desired peptide recovery in a single fraction when compared to the other purification attempts. While the purity of each fraction analyzed is relatively consisitent, the fractions collected with low concentrations of TFA in the mobile phase contain both early and late eluting impurities, potentially complicating future purification efforts.
Given these data, I'm a little torn. The recovery achieved with the low TFA concentrations is definitely appealing when considering follow up HPLC polishing. But that being said, the clarity in the chromatogram that is achieved for the highest concentration of TFA simplifies the individual fraction analysis. The recovery can be improved by simply combining more fractions. I had anticipated a more significant difference in the purity as the modifier concentration changed. But this was a very interesting experiment that will lead to more in the future!
To learn more about how HPFC can be used to decrease your peptide purification time, follow the link below.