Feb 6, 2023 11:59:34 AM
By Bob Bickler

A good question I get asked frequently to which there is no specific value. When asked this question I answer, “it depends on your sample and how good your separation is”; not a satisfying response, but it is the truth.
Column loading capacity is based on a number of factors…
- Sample complexity (number of compounds)
- Sample separation method
- Isocratic
- Linear gradient
- Step gradient
- Sample separation (how well your target is separated from the by-products and impurities)
- Retention
- Selectivity
- Resolution
- Solubility in…
- Mobile phase
- Dissolution solvent
- Compound chemistry – neutral, acidic, basic, polar, lipophilic
- Load technique
- Liquid
- Dissolution solvent choice
- Dry
- Sorbent used
- Liquid
- Purity and yield goals
- Higher purity = lower loading
- Higher yield = higher loading
As a general rule, reversed-phase columns have lower loading capacity compared to normal-phase silica columns. Why, because reversed-phase media has lower available surface area (bonding C18 to silica reduces surface area) and different separation mechanism (partitioning vs. adsorption/desorption).
If you check various flash column vendors you will find silica loading capacities up to 10% and even 20% of media weight. In contrast, typical published reversed-phase capacities are 1% - 2% of media weight. These are maximum loads and not necessarily meant to be average. Again, it depends on how good your separation is along with the other criteria mentioned above.
For medicinal chemists creating intermediate compounds, yield usually is more important than purity with 80-85% purity deemed acceptable in many cases in order to perform the next synthetic step. Historically, medicinal chemists have utilized normal-phase flash chromatography for intermediate purification but have started to migrate towards reversed-phase as their synthetic products’ chemistry has become more polar and complex along coupled with a need/desire to reduce hazardous solvent use. Because of this migration to reversed-phase, understanding column loading capacity has increased in importance.
To test capacity, I purified the products of two reactions synthesized using a Biotage® Initiator+ after dissolving in DMSO for purification.
Scouting Runs
I found a 25-60% methanol gradient over 10 CV suitable for both purifications. I did, however, slightly modify the method for reaction 2 by inserting an initial 2 CV segment at 5% B to flush the DMSO and maximize yield; this change did not impact resolution.
To determine my separation quality, I loaded ~10 mg of each reaction mixture on a Biotage® Sfär C18 column (12 gram) to determine each purification’s resolution, Figure 1.
/Blogs%20ONLY/BA%20and%20MBA%20scouting%20runs.png?width=819&height=478&name=BA%20and%20MBA%20scouting%20runs.png) Figure 1. Scouting runs. Top - reaction 1. Bottom - reaction 2. Both reaction mixtures show good separation of the synthesized compounds.
Figure 1. Scouting runs. Top - reaction 1. Bottom - reaction 2. Both reaction mixtures show good separation of the synthesized compounds.
The scouting runs revealed sufficient compound retention and separation to facilitate determining each eluting compound’s resolution from their nearest eluting neighbors – a critical parameter to know when looking to maximize your purification efficacy. As resolution increases, so does loading capacity!
The important values in the resolution calculation include the elution time, or elution volume, for each adjacent peak’s apex and the peak width, or peak volume, measured at the baseline for the same two peaks. This data was obtained from the chromatograms and tabulated in Table 1.
Table 1. Scouting run data used to determine resolution value
| Reaction 1 | Reaction 2 | |||||
| Peak 1 | Peak 2 | Peak 3 | Peak 1 | Peak 2 | Peak 3 | |
| Peak volume (mL) | 8 | 25 | 18.5 | 12 | 17.5 | 13 |
| Elution volume (mL) | 89 | 104 | 129.5 | 119 | 142.5 | 160.5 |
| Resolution | 0.91 | 1.17 | 1.59 | 1.18 | ||
How did I calculate resolution? Well, resolution is calculated as follows (Neue, 1997)…
Rs = 2(V2-V1)/(W1+W2)
Where Rs = resolution
V1 is the elution volume apex for the leading peak
V2 is the elution volume apex for the trailing peak
W1 is the peak volume (at baseline) for the leading peak
W2 is the peak volume (at baseline) for the trailing peak
So, what does this data provide in terms of determining loading capacity? Well, for starters, as previously mentioned, the larger the resolution, the higher the load. So, with a resolution of 0.91, the separation between peak 1 and peak 2 in reaction 1 is fairly low, but usable. Though better, the same is true for the resolution between peaks 2 and 3 (Rs 1.17). These resolution values, unfortunately, limit the scaling range. When looking to maximize sample load, the lower Rs of the two value, 0.91 in this case, is the limiting factor.
The reaction mix 2 separation shows improved selectivity and therefore, increased resolution for the first two peaks (Rs 1.59) but virtually identical resolution between peaks 2 and 3 (Rs 1.18) as that of reaction 1. This relatively small increase in minimum resolution, 1.18 vs. 0.91, does increase our potential loading capacity as you will see later.
Scaling study
Using this information, I conducted an empirical loading study injecting increasingly larger amounts of the reaction products. Data from this study determined the load capacity for each reaction mixture possible to attain my minimum purity target of >80%.
The process involved increasing the load 2x over the previous run, collecting the peaks, drying the fractions, testing them for purity using the same method and column. Fraction purity was determined by comparing the target peak’s height to the cumulative heights of all the peaks, excluding the injection solvent peak, Table 2. For the purpose of this study, the target is peak 2 for each purification.
Table 2. Loading study data
| Reaction 1 | Reaction 2 | ||||||
| Load (mg) | Target height | Total by-product height | % Purity | Load (mg) | Target height | Total by-product height | % Purity |
| 26 | 204 | 20 | 91 | 21 | 902 | 22 | 98 |
| 51 | 761 | 79 | 91 | 43 | 492 | 11 | 98 |
| 102 | 1167 | 250 | 82 | 86 | 1029 | 51 | 95 |
| 171 | 1477 | 507 | 74 | ||||
The results showed that with reaction 1, 91% purity was achieved with a loads of 26 mg (0.21% load) and 51 mg (0.43% load) but dropped to 82% compound purity with a 102 mg load (0.85% load) meeting my purity requirement, Figure 2. The load capacity for reaction 1 is 102 mg on a 12-gram C18 column.
/Blogs%20ONLY/Benzylamine%2051%20mg%20purification%20and%20f3%20analysis-1.png?width=819&height=473&name=Benzylamine%2051%20mg%20purification%20and%20f3%20analysis-1.png)
/Blogs%20ONLY/Benzylamine%20102%20mg%20purification%20and%20F4%20analysis-1-4.png?width=819&height=475&name=Benzylamine%20102%20mg%20purification%20and%20F4%20analysis-1-4.png)
Figure 2. Crude reaction purification and major fraction purity analysis for reaction 1. Top - 51 mg crude load (above) and fraction 2 purity analysis (below). Bottom - 102 mg crude load (above) and fraction 4 purity analysis (below).
The reaction 2 purification on the same 12-gram C18 column provided 74% purity with a 171 mg load (1.43% load), below my purity target of >80%, but a 95% purity with a load of 86 mg (0.71% load), Figure 3.
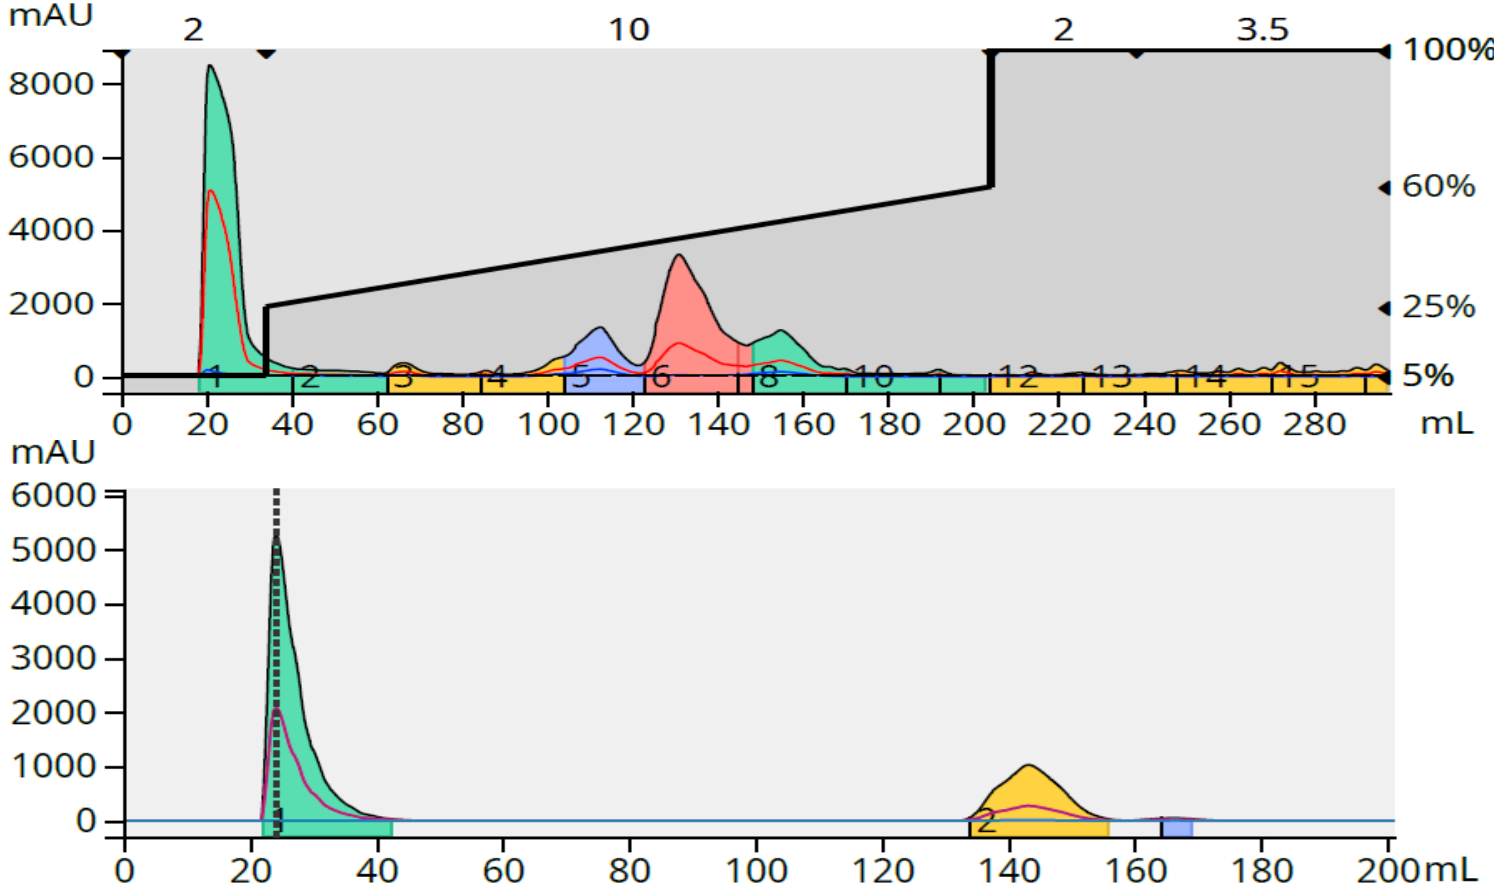
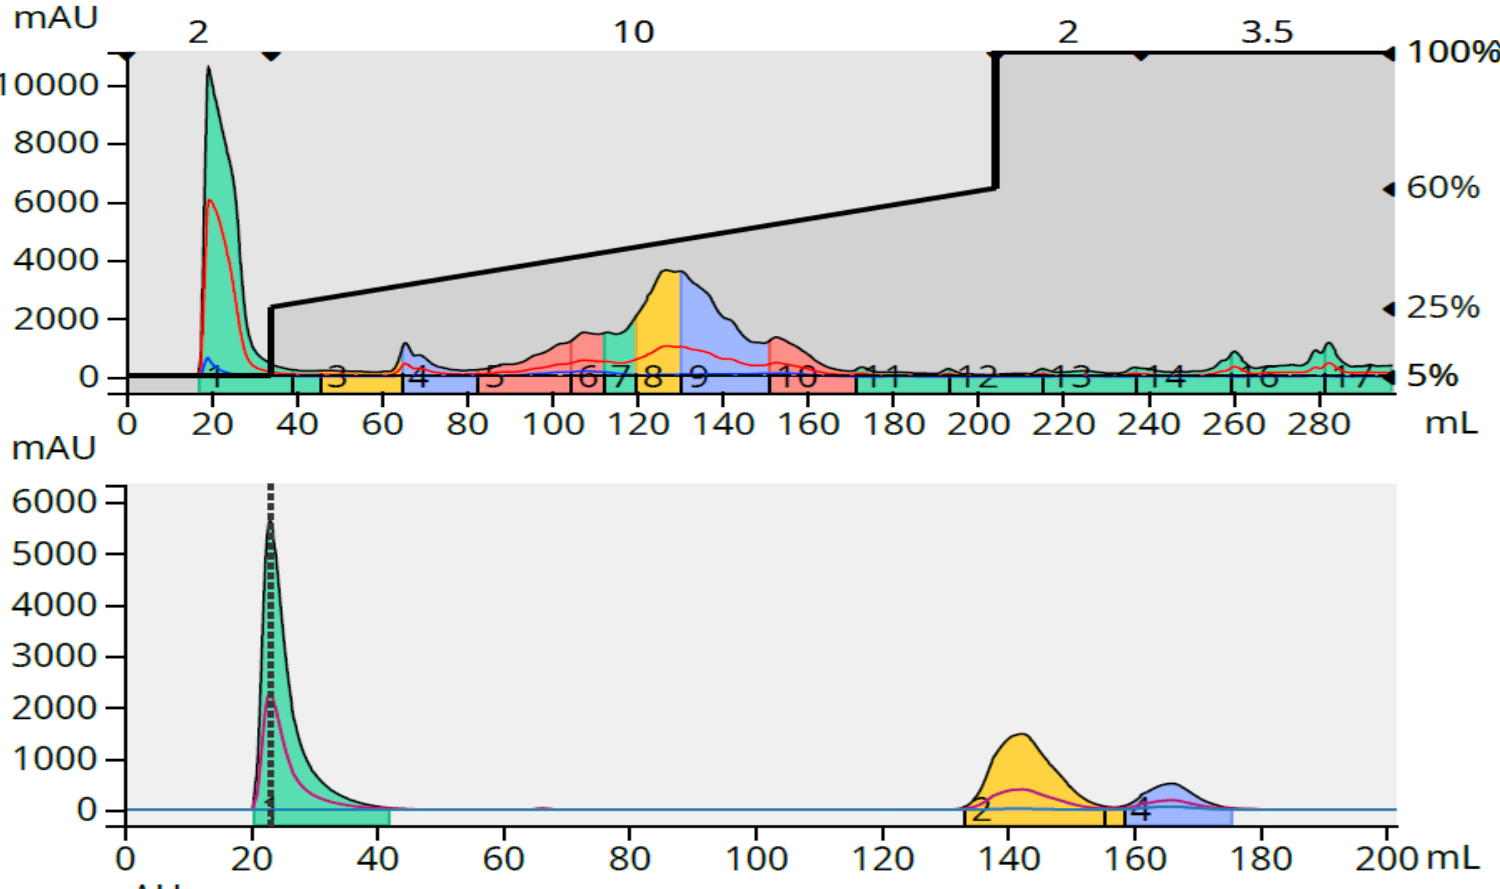
Figure 3. Crude reaction purification and major fraction purity analysis for reaction 2. Top - 86 mg crude load (above) and fraction 6 purity analysis (below). Bottom - 171 mg crude load (above) and fractions 8+9 purity analysis (below).
From this data we now know the load capacity to achieve my purity goal of >80% with reaction 1 is 0.85% of the column mass (12 g) or 102 mg. However, we only know that the maximum capacity for reaction 2 is lower than 1.43% or 171 mg since that load provided only 74% target compound purity.
A plot of load vs. purity for reaction 2 shows a linear relationship allowing me to guestimate the load needed to achieve the >80% purity threshold, which is approximately 140 mg, Figure 4.
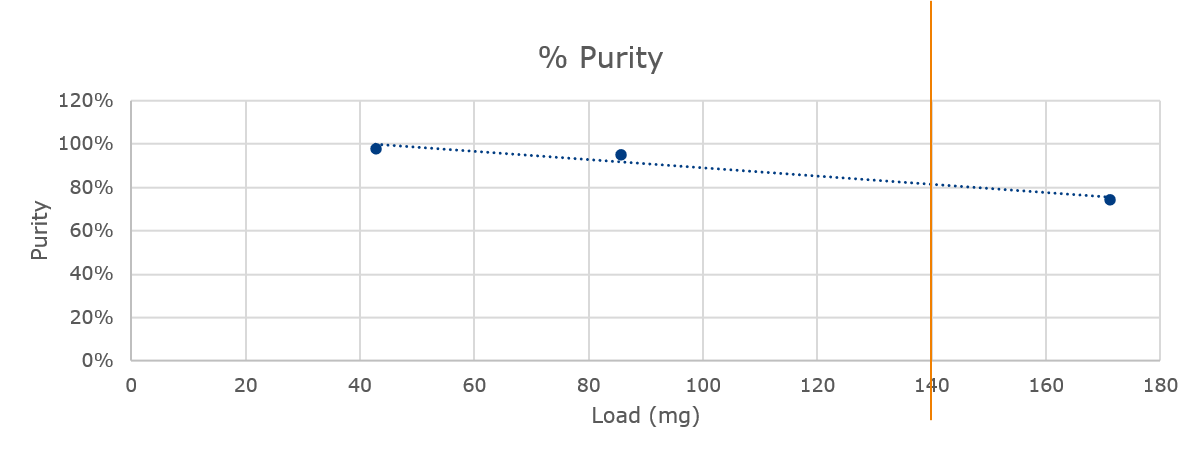
Figure 4. Graph of sample load vs. measured purity for reaction 2 shows a linear trend with a load estimate of 140 mg.
To test if this calculated load was accurate, I purified 140 mg of the reaction mixture resulting in an 89% purity for my target (middle peak in green), Figure 5.
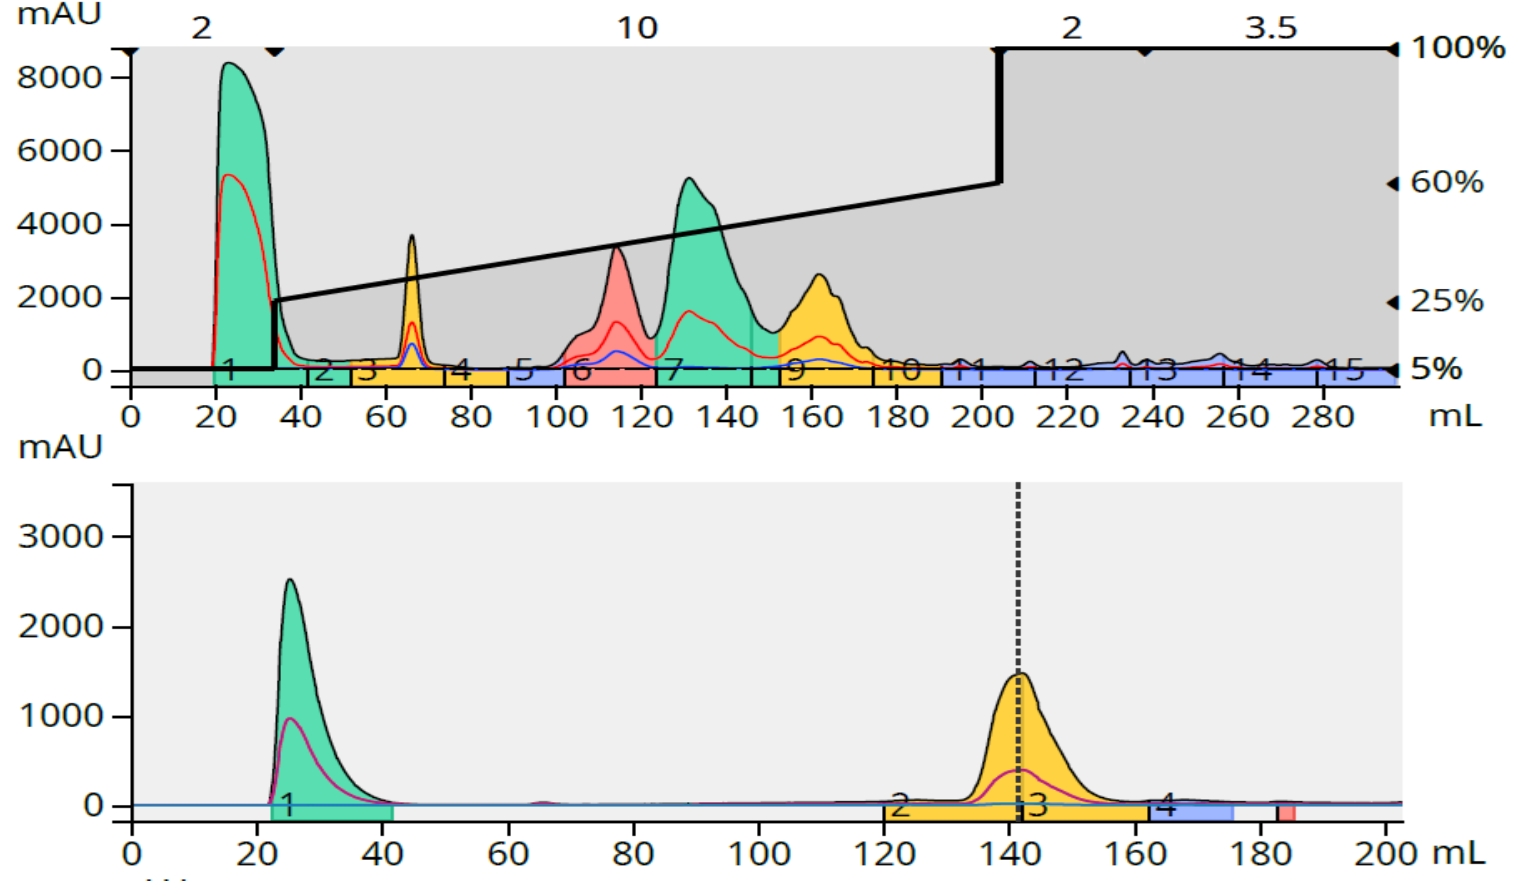
Figure 5. Crude reaction purification and major fraction purity analysis for reaction 2. Top - 140 mg crude load. Bottom - fraction 7 purity analysis.
With an 89% target compound purity with a 140 mg load I now know the graph's estimate was achievable resulting an a loading capacity of 1.3% for reaction 2.
Bottom line
The bottom line from this work is that with a little upfront, small scale chromatography work, you can calculate your target compound’s resolution from a known sample load and determine the sample load sufficient to meet your target compound's purity requirement.
For more information on reversed-phase flash chromatography, download our webinar - Succeeding with Reversed-phase Flash Chromatography.
